Gulf of Maine Warming Update: Fall 2022
Announcements | Jan 12, 2023
Over the past decade, scientists have led a body of research that highlights the rapid pace of warming in the Gulf of Maine. To help keep you informed, we share seasonal and annual updates about conditions in the Gulf of Maine.
Read on for an inside look at what we've learned in our fall 2022 Gulf of Maine warming update.

Highlights
The average SST for the Gulf of Maine during the fall (September 1 – November 30) of 2022 was 60.00°F, making it the 2nd hottest fall on record for the period of 1982 – 2022 — the period over which the satellite data used are available. This seasonal average temperature is 4.44°F above the long-term (1982 – 2011) fall average of 55.56°F.
Weekly Temperatures
In the below table, we highlight how the SST for each week this fall compares to a 30-year baseline period (i.e., climatological averages from 1982 through 2011).
The observed SST, long-term average SST, and SST anomalies (i.e., departures from the long-term average SST) are shown. As expected, SSTs in the fall begin to drop as the season progresses, with anomalies showing no clear trend over the course of the season. Rather, departures from the long-term average hovered between 3-5°F above normal, with a few weeks punctuated by anomalies in excess of 6°F.

Monthly Statistics
Looking at monthly averages (as opposed to week-by-week conditions), we see each month was 3.84°F or more above the 1982 – 2011 climatological average. November showed the largest deviation from the long-term climatological average, with an average SST anomaly of 5.33°F, the strongest average monthly anomaly of any month this year.

Seasonal Trends and Anomalies in Context
The Gulf of Maine is an area of particular interest to the scientific community because of the remarkable rate of warming it has experienced in recent years, coupled with its importance as a major driver for the regional economy.
When looking at average fall temperatures from the beginning of the satellite record in 1982, there is a clear long-term increase, with SSTs warming at a rate of 1.16°F per decade. This rate of warming is almost 4.5 times faster than the rate that global ocean temperatures are warming during these same months, a rate of 0.26°F per decade.

The unprecedented levels of warmth over the past decade or so are consistent with what researchers believe has been a distinct regime shift in terms of the major influences on SSTs in the Gulf of Maine. The drivers of this temperature regime shift (e.g., a potential weakening of the Atlantic Meridional Overturning Circulation and widening of the Gulf Stream) have been well-documented in the peer-reviewed literature, including through research by GMRI scientists.
How Does 2022 Compare?
2022 was the 2nd warmest fall season observed in the Gulf of Maine during the 40 years we have satellite data to analyze. The top five warmest fall seasons have all occurred since 2012.

Marine Heatwave Conditions
The most commonly used definition of a “marine heatwave” (MHW) is when daily average SSTs exceed the 90th percentile of a climatological (i.e., 30-year) average for at least five consecutive days. Gaps of two days or less in this threshold do not constitute a break in the MHW event.
Using this broadly accepted definition, the Gulf of Maine experienced MHW conditions for 97% of fall 2022 A brief 3-day stretch in early October (Oct 3 – 5) was the only time when SSTs fell below the threshold for a MHW during fall 2022.

Presenting SST conditions in terms of anomalies (Figure 4) as opposed to absolute values (Figure 3) illustrates in greater detail the magnitude of MHW conditions throughout the fall. The most extreme anomalies occurred in November, with temperatures exceeding 6°F above the climatological average for a stretch of 16 days.

Heatmap of Temperature Anomalies and Heatwave Events
Looking at the full record of daily SST anomalies in the Gulf of Maine (Figure 5), the distinct temperature regime shift beginning around 2010 is evident. Indeed, since 2012, the Gulf of Maine has experienced far more persistent MHW conditions (indicated by solid black lines) than at any other point in the satellite record.

Monthly Rankings Heatmap

Spatial Distribution of Seasonal Anomalies
From a spatial perspective, the Gulf of Maine and surrounding areas experienced above average SSTs for much of the region during fall 2022, but the warmest patches were to the south and east of Georges Bank, mostly outside the domain analyzed in the preceding sections. The highest seasonally averaged anomaly of any location in our study area was 8.88°F.

Monthly Temperature Anomalies
Average monthly SST anomalies are shown in Figure 9. The warmest anomalies were concentrated south and east of Georges Bank in October and November. The spread of warm anomalies can be seen throughout the Gulf of Maine in all months, particularly in November. Monthly-averaged SST anomalies at the southern and eastern edges of the Gulf of Maine and surrounding areas reached temperatures more than 10°F warmer than during our climate reference period (1982 – 2011).

About the updates
Over the past decade, scientists at the Gulf of Maine Research Institute have led a body of research that highlights the rapid pace of warming in the Gulf of Maine. To keep you informed, we share seasonal updates about conditions in the Gulf of Maine.
Note About the Data: The figures in this report are created using remotely-sensed satellite data as part of publicly funded research efforts. Satellite SST data was obtained from NOAA’s National Center for Environmental Information (NCEI), with all maps and figures displaying NOAA’s Optimum Interpolation Sea Surface Temperature Data.
Note on Preliminary Data: This dataset has a 2-week latency period, during which values may change due to quality control measures. Any data within 14 days of the publishing date may be subject to change.
Note on Data Sources:
NOAA_ERSST_V5 data provided by the NOAA/OAR/ESRL PSL, Boulder, Colorado, USA.
NOAA High Resolution SST data provided by the NOAA/OAR/ESRL PSL, Boulder, Colorado.
If you would like to cite this report, please use: Gulf of Maine Research Institute. 2023. Gulf of Maine Warming Update: Fall 2022. https://gmri.org/stories/gulf-of-maine-warming-update-fall-2022/
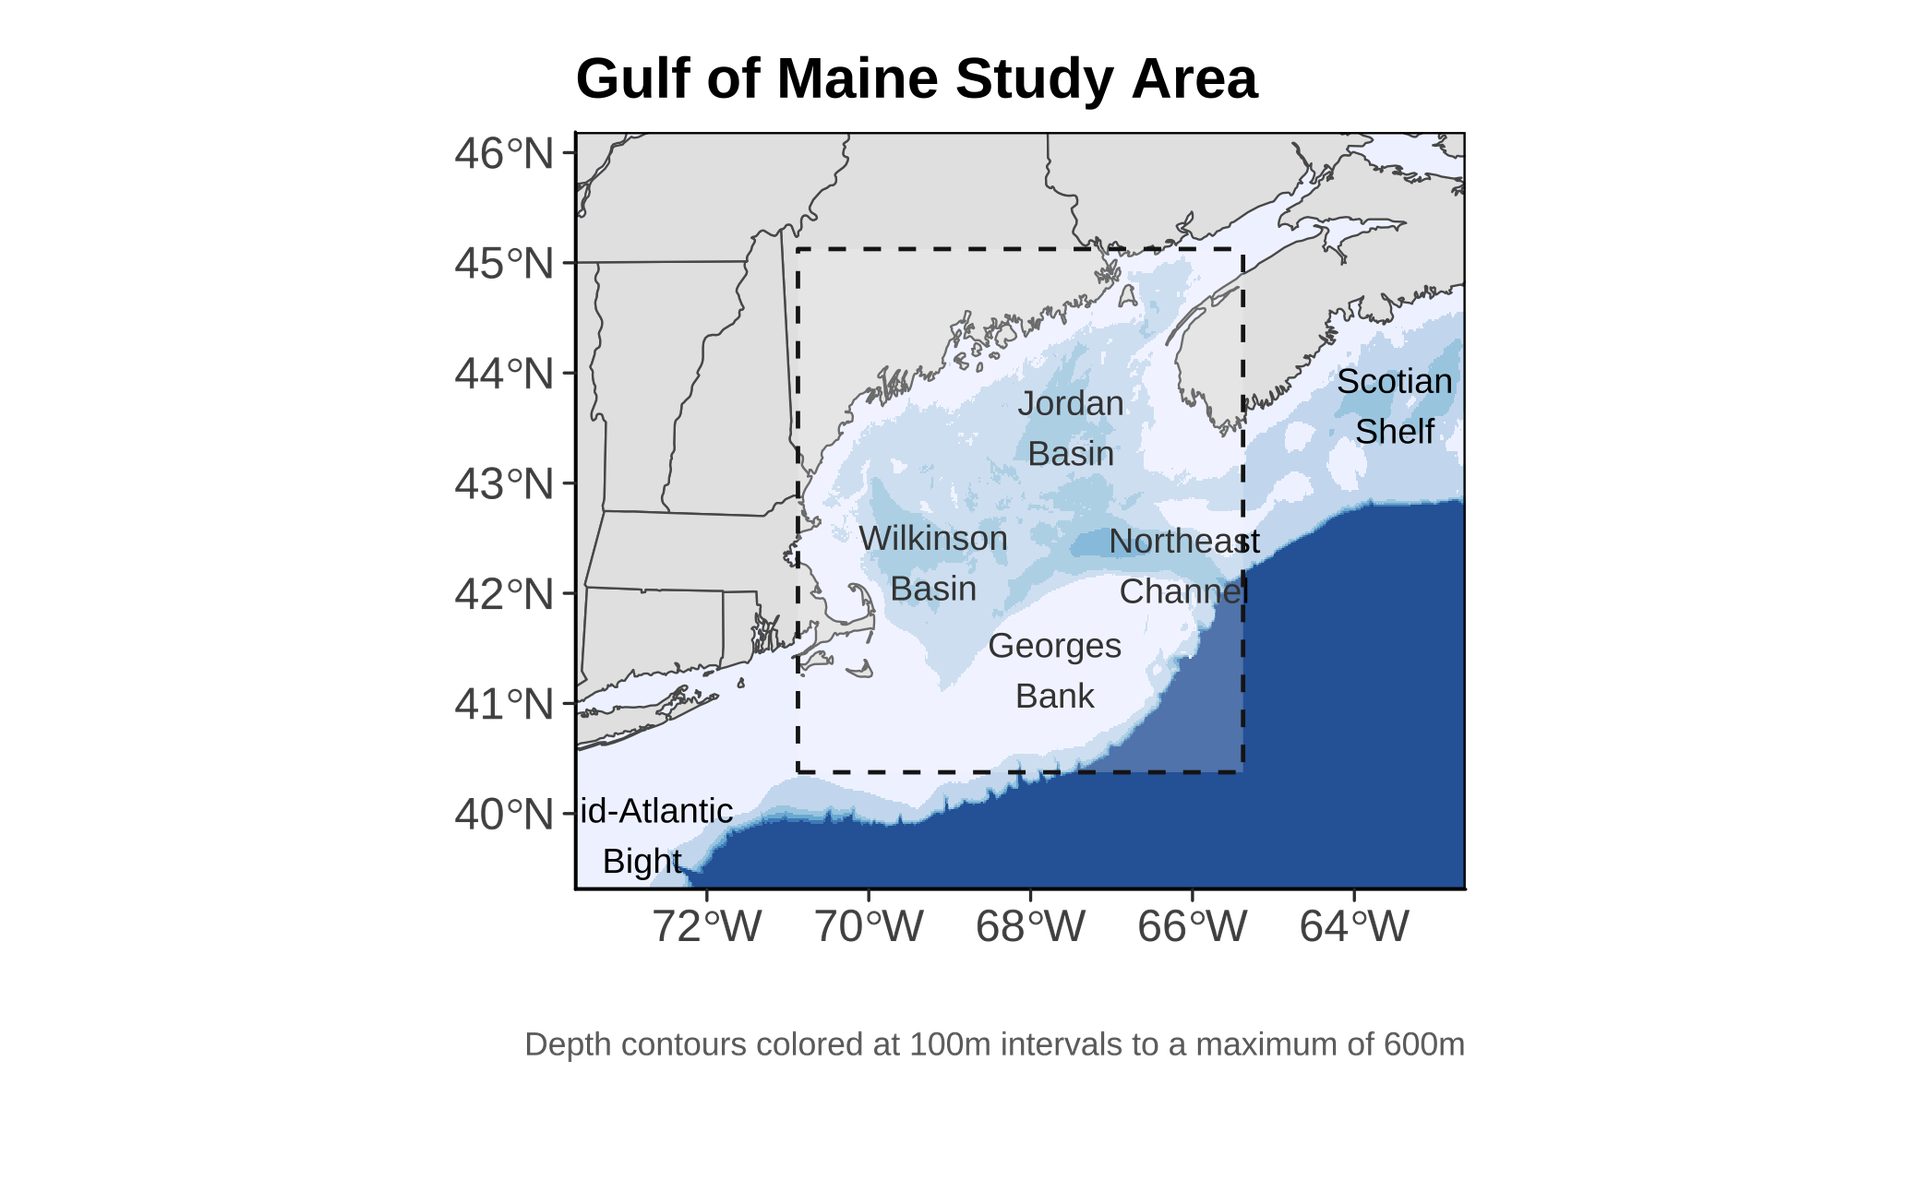
The Gulf of Maine Region
For analyses like these, it is important to be clear about the spatial extent that “defines” the Gulf of Maine (figure below), as different borders could produce different results. The spatial domain we use as the “Gulf of Maine” is displayed below. This area is consistent with previous reports and publications GMRI has produced.