Gulf of Maine Warming Update: Spring 2024
Reports | Jul 2, 2024
Over the past decade, scientists have led a body of research that highlights the rapid pace of warming in the Gulf of Maine. To help keep you informed, we share seasonal and annual updates about conditions in the Gulf of Maine.
Read on for an inside look at what we've learned in our spring 2024 Gulf of Maine warming update.

Spring 2024 Highlights
For this seasonal report we present an analysis of sea surface temperature (SST) for spring 2024, defined as the period extending from March 1, 2024 through May 31, 2024.
Springtime in the Gulf of Maine is when SSTs dip to their annual lows (typically in March), followed soon-after by a climb in temperature and the pronounced spring peak in phytoplankton productivity. Vertical mixing over the winter replenishes critical nutrients to the surface waters, which together with longer durations of sunlight, fuel the spring phytoplankton bloom. This is a very active time of year for marine species looking to take advantage of the seasonal bounty of plankton.
This year, the average spring SST for the Gulf of Maine was 43.88°F. This seasonal average temperature was 1.05°F above the 1991 – 2020 climatological reference period (CRP) spring average of 42.84°F, ranking as the 11th warmest spring on record (extending 40+ years since satellite observations began).
Weekly Temperatures
Table 1 highlights how the SST for each week this spring compares to the 1991 – 2020 CRP for the area shown in Figure 7. The observed SST, long-term average SST, and SST anomalies (i.e., departures from the long-term average SST) are shown.
Averaged over the entire season, spring SSTs this year were +1.05°F above normal, with weekly SST anomalies ranging from -0.90°F to +3.55°F. A climb in temperature at the end of May boosted an otherwise mild season.

Monthly Statistics
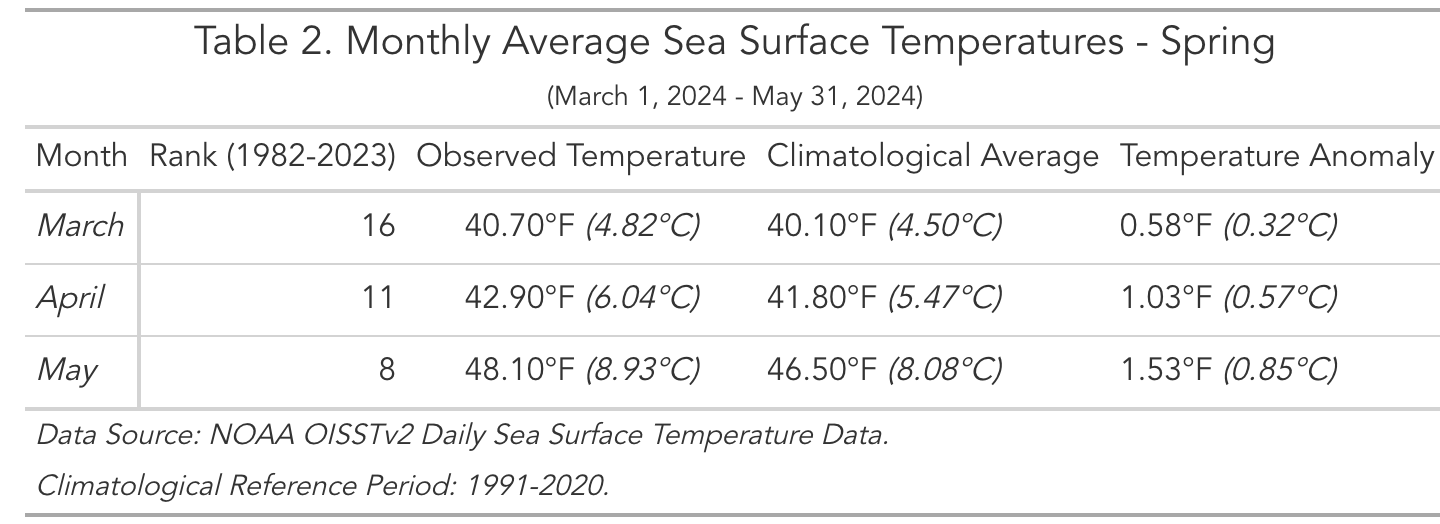
Table 2 shows monthly average SST for spring 2024. March SSTs were slightly above the 1991 – 2020 CRP, with SST anomalies increasing during April and again in May.
May SSTs deviated most from the long-term climatological average, with an average SST anomaly of 1.53°F. This anomaly represented the 8th warmest May on record and the first month this year to rank among the top ten since record keeping began in the early 1980s.
How Does this Spring Compare to the Past?
2024 was the 11th warmest spring season observed in the Gulf of Maine during the 41 years we have satellite data to analyze, a departure from spring seasons in the past three years, which experienced much warmer conditions (Figure 1).

Seasonal Trends and Long-Term Global Context
The Gulf of Maine is an area of particular interest to the scientific community because of the remarkable rate of warming it has experienced in recent years.
Figure 2 illustrates the average spring temperature anomaly for each year in the Gulf of Maine since the beginning of the satellite record in 1982, overlaid with long-term SST anomaly trends for the Gulf of Maine (orange) and global oceans (blue).
The spring rate of warming for the Gulf of Maine (0.56°F per decade) is roughly 2.5x as fast as the spring warming rate globally (0.23°F per decade).

Marine Heatwave Conditions
The most commonly used definition of a “marine heatwave” (MHW) is when daily average SSTs exceed the 90th percentile of a climatological (i.e., 30-year) average for at least five consecutive days. Gaps of two days or less in reaching this threshold do not constitute a break in a single MHW event. Using this broadly accepted definition, the Gulf of Maine has experienced MHW conditions for 9% of days this spring, beginning at the end of May and extending into the start of summer.

Heatmap of Temperature Anomalies and Heatwave Events
Looking at the full record of daily SST anomalies in the Gulf of Maine (Figure 4), a distinct thermal regime shift beginning around 2010 is evident. Indeed, since 2012, the Gulf of Maine has experienced far more persistent warm anomalies (deep red color bars) and MHW conditions (indicated by solid black lines) than at any other point in the satellite record.
Spring SSTs in the previous three years had been noteworthy for their extended MHW conditions. The relatively cool spring in the Gulf of Maine this year was an extension of cooler fall conditions, which persisted through the 2023-2024 winter, and can be partially attributable to the shift from El Niño to La Niña conditions globally.

Spatial Distribution of Seasonal Anomalies
When viewed spatially, almost the entire Gulf of Maine region studied experienced above-average SSTs during spring of 2024 (Figure 5). In general, conditions were cooler further offshore and warmest nearshore (particularly in the Bay of Fundy. The highest seasonally averaged SST anomaly in the Gulf of Maine was 3.99°F — located near the Bay of Fundy.

Spatial Distribution of Monthly Temperature Anomalies
Monthly average SST anomalies for spring 2024 are shown spatially in Figure 6. During March, above-average SSTs occupied the continental shelf, with larger warm anomalies increasing throughout the spring in nearshore protected areas. Above average SSTs over Georges Bank weakened throughout the spring, as waters with below average SSTs situated just off the shelf-break influenced the region more as the season progressed.

Spring 2024 may have felt relatively cool — and, indeed, it was in comparison to the past three years. The main driver of that cooling has been the global transition from El Niño to La Niña conditions. But the long-term trend in warming, both here in the Gulf of Maine and globally, remains undeniable — and will persist.
Dave Reidmiller, Ph.D. Chief Impact Officer![This is the staff photo for david reidmiller]() Dave Reidmiller, Ph.D. Chief Impact Officer
Dave Reidmiller, Ph.D. Chief Impact Officer
About the Updates
Over the past decade, scientists have led a body of research that highlights the rapid pace of warming in the Gulf of Maine. To help keep you informed, we share seasonal and annual updates about conditions in the Gulf of Maine.
The Gulf of Maine Region
For analyses like these, it is important to be clear about the spatial extent that “defines” the Gulf of Maine (Figure 7), as different borders could produce different results. The spatial domain we use as the “Gulf of Maine” is displayed below. This area is consistent with previous seasonal and annual reports that scientists at GMRI have produced.

Note About the Data: The figures in this report are created using remotely-sensed satellite data as part of publicly funded research efforts. Satellite SST data was obtained from NOAA’s National Center for Environmental Information (NCEI), with all maps and figures displaying NOAA’s Optimum Interpolation Sea Surface Temperature Data.
Citing This Work
If you would like to cite this report, please use:
Gulf of Maine Research Institute. 2024. Gulf of Maine Warming Update: Spring 2024. https://gmri.org/stories/gulf-of-maine-warming-update-spring-2024/