Gulf of Maine Warming Update: Winter 2023–24
Reports | Apr 2, 2024
Over the past decade, scientists have led a body of research that highlights the rapid pace of warming in the Gulf of Maine. To help keep you informed, we share seasonal and annual updates about conditions in the Gulf of Maine.
Read on for an inside look at what we've learned in our winter 2023 – 24 Gulf of Maine warming update.

Winter 2023 – 24 Highlights
For this seasonal report we present an analysis of sea surface temperature (SST) for winter 2023 – 24, defined as the period extending from December 1, 2023 through February 29, 2024.
Winter is an important time of year for the Gulf of Maine. During this time of year, SSTs are typically falling, weakening the stratification of surface waters from deeper waters that occurs during warmer months. The breakdown of stratification allows for vertical mixing in the water column, which helps transport important nutrients up into the near-surface waters. These nutrients fuel the spring phytoplankton blooms that support the high productivity in the region. Vertical mixing may be enhanced in winter with the help of Nor’easters, which are most common this time of year and stir up the water column with rough seas and strong winds.
This winter, the average SST for the Gulf of Maine was 43.35°F. This seasonal average temperature was 0.71°F below the 1991 – 2020 climatological reference period (CRP) winter average of 44.06°F.
Weekly Temperatures
Table 1 highlights how the SST for each week this winter compares to the 1991 – 2020 CRP for the area shown in Figure 8. The observed SST, long-term average SST, and SST anomalies (i.e., departures from the long-term average SST) are shown.
Winter SSTs were on average 0.71°F below normal, with weekly SST anomalies ranging from -1.68°F to +0.41°F. All but one week at the end of 2023 recorded SSTs that were below the 1991 – 2020 average.

Monthly Statistics
Table 2 shows monthly average SST for winter 2023 – 24. December SSTs were slightly below the 1991 – 2020 CRP, but the average SST anomalies for January and February were near or more than 1°F below the 1991 – 2020 CRP.
February showed the largest deviation from the long-term climatological average, with an average SST anomaly of -1.08°F, making it the 34th warmest February on record. Said another way, it was the 10th coldest February in the satellite era. January averaged –0.94°F below the 1991 – 2020 climatology, making it the 25th warmest (19th coldest) January since 1982.
December was more mild, recording a monthly average SST that was 0.13°F below the long-term average, respectively. This made December the 19th warmest (24th coldest) since 1982.

How Did Winter 2023–24 Compare to the Past?
Winter 2023 – 24 was the 23rd warmest (18th coolest) winter season observed in the Gulf of Maine during the 41 years we have satellite data to analyze, a departure from winter seasons in recent years, which experienced well-above average SSTs.

Seasonal Trends and Long-Term Global Context
The Gulf of Maine is an area of particular interest to the scientific community because of the remarkable rate of warming it has experienced in recent years, coupled with its importance as a major driver for the regional economy.
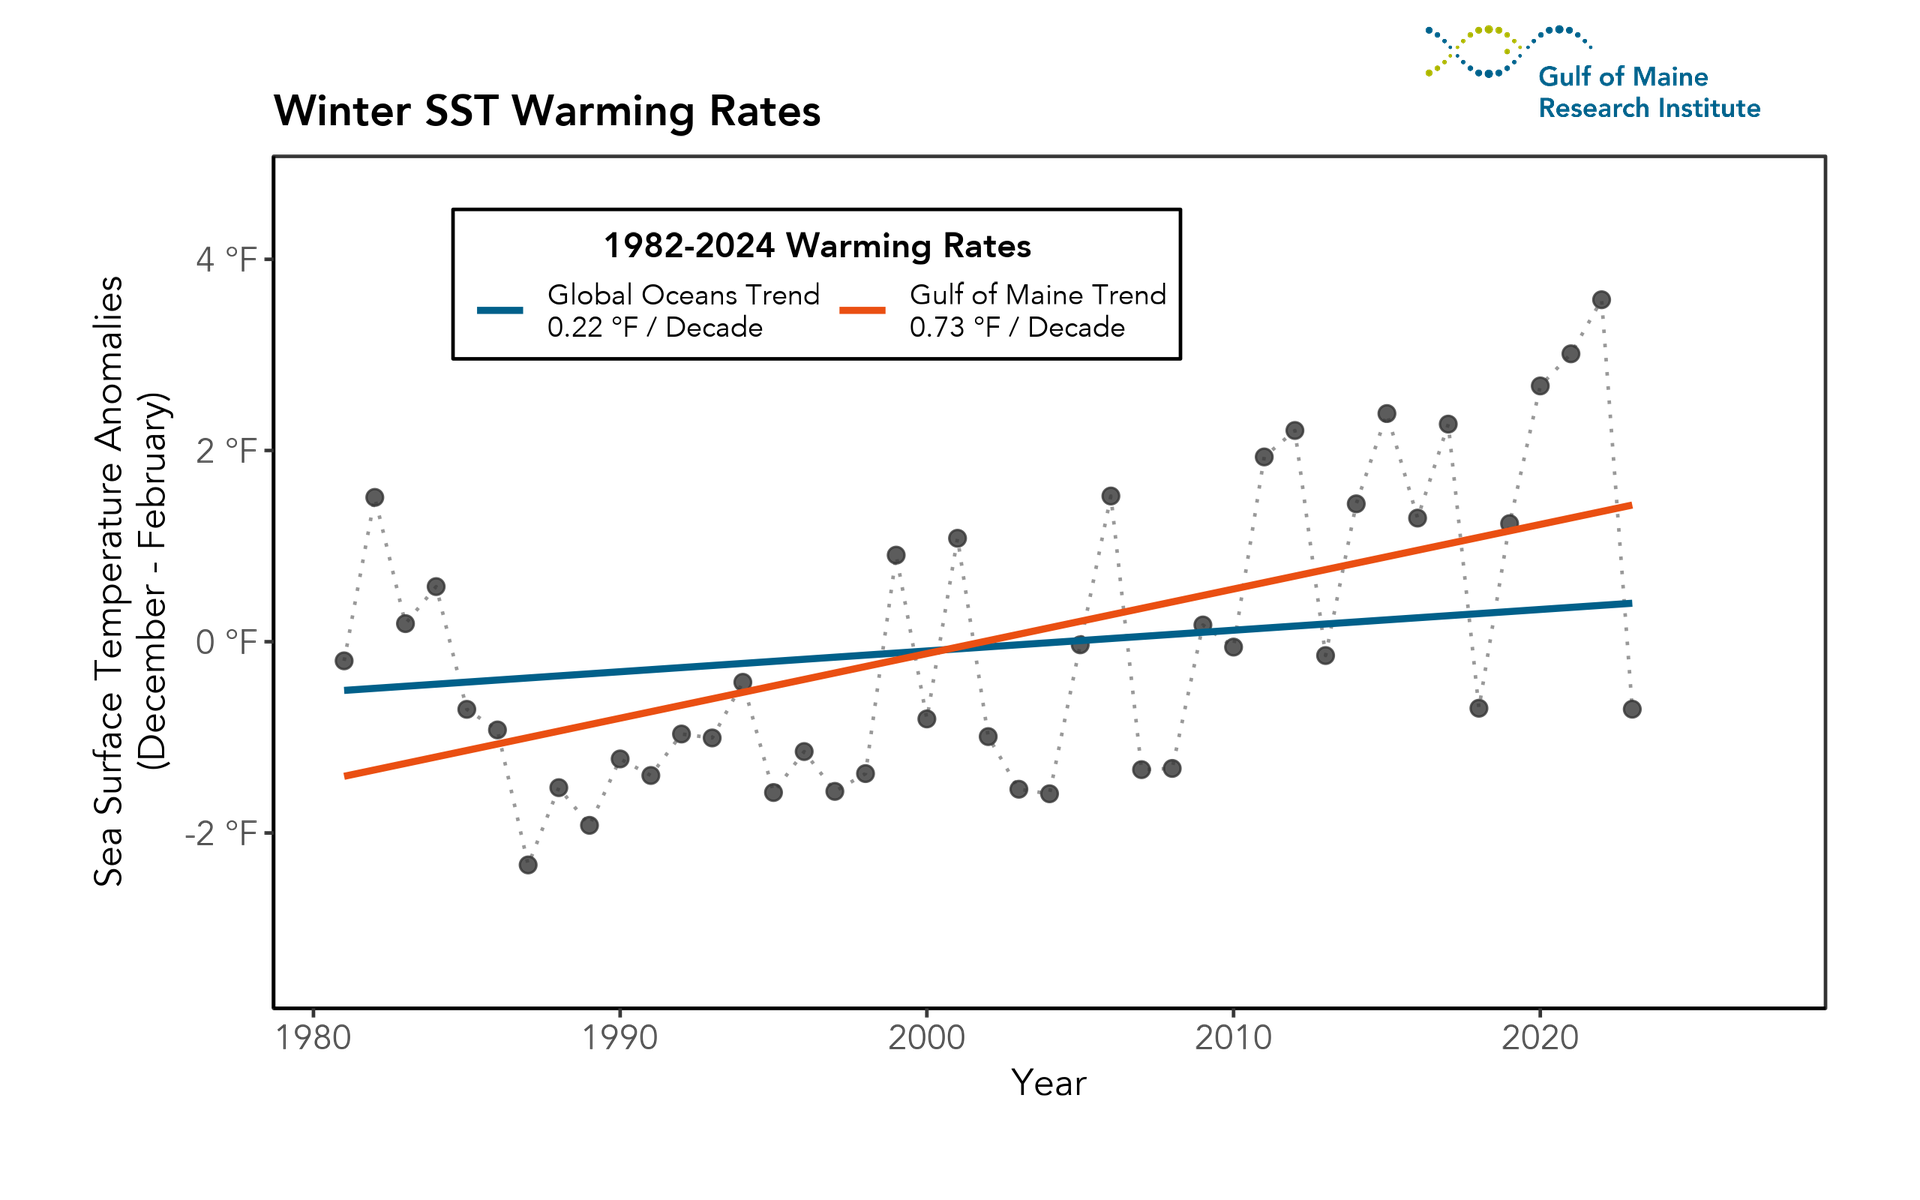
Figure 2 illustrates the average winter temperature anomaly for each year in the Gulf of Maine since the beginning of the satellite record in 1982, overlaid with long-term SST anomaly trends for the Gulf of Maine (orange) and global oceans (blue).
The winter rate of warming for the Gulf of Maine (0.73°F per decade) is roughly ~3.3x as fast as the warming rate for oceans globally (0.22°F per decade).
The winter SST anomaly for the Gulf of Maine in winter 2023 – 24 was 4.29°F cooler than that in 2022, the largest year-over-year decline in winter temperature anomalies in the satellite record.
Marine Heatwave Conditions
The most commonly used definition of a “marine heatwave” (MHW) is when daily average SSTs exceed the 90th percentile of a climatological (i.e., 30-year) average for at least 5 consecutive days. Gaps of 2 days or less in this threshold do not constitute a break in a single MHW event.
Using this broadly accepted definition, the Gulf of Maine experienced MHW conditions for 0% of days this winter.

Heatmap of Temperature Anomalies and Heatwave Events
Looking at the full record of daily SST anomalies in the Gulf of Maine (Figure 5), the distinct thermal regime shift beginning around 2010 is evident. Indeed, since 2012, the Gulf of Maine has experienced far more persistent MHW conditions (indicated by solid black lines) than at any other point in the satellite record.
Winter SSTs in the previous 3 years had been noteworthy for their extended MHW conditions (Figure 2). The relatively cold winter in the Gulf of Maine this year was an extension of cooler fall conditions. Both stand out against above-average winter conditions during most years since 2012.

Spatial Distribution of Seasonal Anomalies
From a spatial perspective, much of the Gulf of Maine experienced below-average SSTs during the winter of 2023 – 24. In general, conditions were cooler in the deeper-water basins and warmer in shallow protected areas like the Bay of Fundy and Massachusetts Bay. The area (i.e., satellite grid cell) with the highest seasonally averaged SST anomaly in the Gulf of Maine was 2.29°F — located in the Bay of Fundy.

Spatial Distribution of Monthly Temperature Anomalies
Average monthly SST anomalies are shown spatially in Figure 7. During December, we saw modestly warm SST anomalies over about half of the region, particularly over Georges Bank. Cold SST anomalies became prevalent across most of the study region in January and February.

About the Updates
Over the past decade, scientists have led a body of research that highlights the rapid pace of warming in the Gulf of Maine. To help keep you informed, we share seasonal and annual updates about conditions in the Gulf of Maine.
The Gulf of Maine Region
For analyses like these, it is important to be clear about the spatial extent that “defines” the Gulf of Maine (Figure 8), as different borders could produce different results. The spatial domain we use as the “Gulf of Maine” is displayed below. This area is consistent with previous seasonal and annual reports that scientists at GMRI have produced.

Note About the Data: The figures in this report are created using remotely-sensed satellite data as part of publicly funded research efforts. Satellite SST data was obtained from NOAA’s National Center for Environmental Information (NCEI), with all maps and figures displaying NOAA’s Optimum Interpolation Sea Surface Temperature Data.
Citing This Work
If you would like to cite this report, please use:
Gulf of Maine Research Institute. 2024. Gulf of Maine Warming Update: Winter 2023–24. https://gmri.org/stories/gulf-of-maine-warming-update-winter-202324/.