Gulf of Maine Warming Update: Winter 2022–23
Announcements | Apr 17, 2023
Over the past decade, scientists have led a body of research that highlights the rapid pace of warming in the Gulf of Maine. To help keep you informed, we share seasonal and annual updates about conditions in the Gulf of Maine.
Read on for an inside look at what we've learned in our winter 2022–23 Gulf of Maine warming update.

New in 2023: Updating the Climatological Reference Period
In the field of climate science, 30-year time periods are a standard measure for a “climatological reference period” (CRP). Such a timescale adequately captures the natural inter-annual variability of the Earth system to enable rigorous statistical analyses of trends in environmental conditions. This is particularly relevant when presenting statistics such as temperature “anomalies”—or deviations from these 30-year climatological averages. To date, when we presented temperature anomaly data in our seasonal and annual warming updates, we used a CRP of 1982–2011. In part, this was motivated by the fact that reliable satellite data for sea surface temperatures (SST) in the Gulf of Maine became available in 1982 (and 30 years hence brought us to 2011). Beginning with this winter 2022–23 Gulf of Maine warming report, we are using a new 30-year CRP, 1991–2020, reflecting the fact that an additional decade’s worth of data has been collected, enabling us to update our CRP. This change is consistent with best practices used by the international science community. For more information on 30-year CRPs, the motivation for, and implications of updating it to 1991-2020, visit the U.S. “Climate Normals” database or this explainer from the National Oceanic and Atmospheric Administration (NOAA).
Figure 1 provides an interactive view of how updating the CRP (from 1982–2011 to 1991–2020) affects the annual cycle of daily average SST over that 30-year time period. The analysis shows that the annual monthly minimum SST (which occurs in March) increased by 0.39°F in updating the CRP from 1982–2011 to 1991–2020, whereas the annual monthly maximum SST (which occurs in August) increased by 0.97°F. The month with the largest SST change in updating the CRP is September (+1.13°F). The month with the smallest change in updating the CRP is April (+0.29°F). The season with the largest change is fall (+0.97°F). The season with the smallest change in updating the CRP is spring (+0.40°F). These results are consistent with previous seasonal SST analyses by GMRI suggesting that warming is occurring in all seasons in the Gulf of Maine, with the greatest increases being observed in fall and the smallest increases being observed in spring.
Figure 1


This is an interactive figure.
Weekly Temperatures
In Table 1, we highlight how the SST for each week this winter compares to the 30-year CRP (i.e., 1991–2020) for the area shown in at the bottom of this report.
The observed SST, CRP average SST, and SST anomalies (i.e., departures from the CRP average SST) are shown. Weekly SST anomalies were greatest in early- to mid-December, as well as mid- to late-February, with the last week of 2022 and the first week of 2023 experiencing temperatures closest to the long-term average.

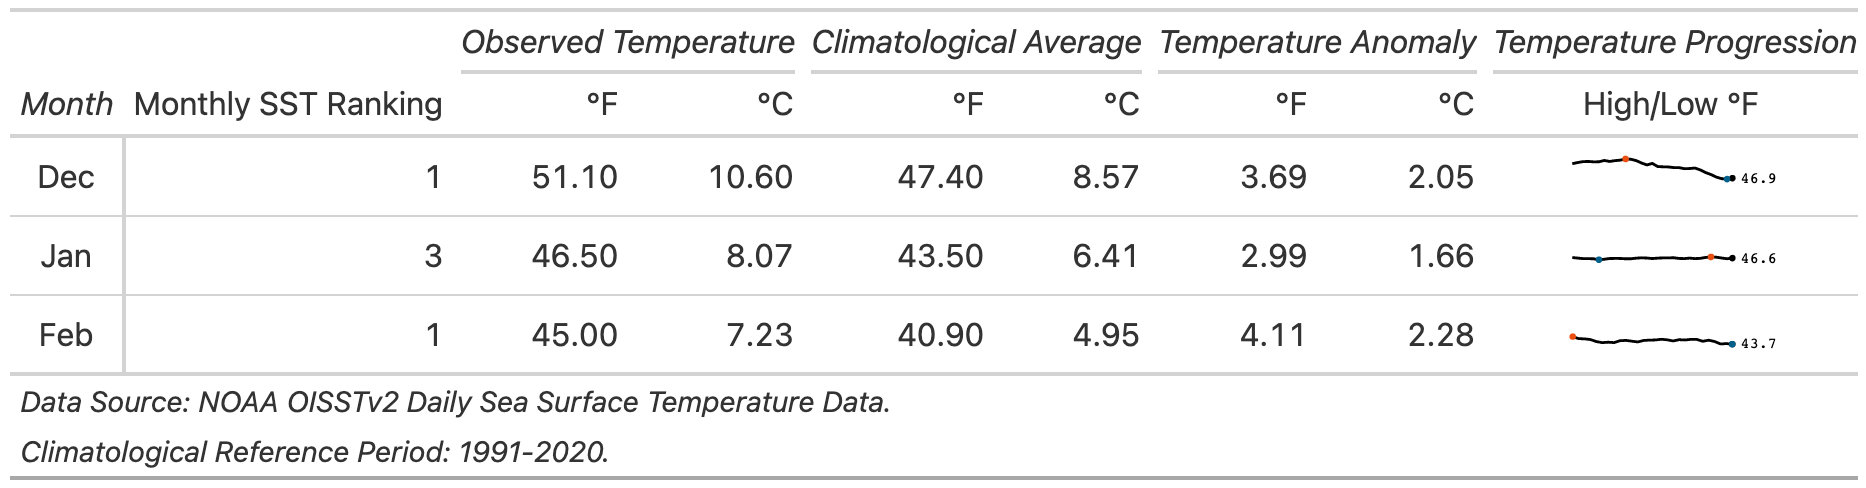
Monthly Statistics
Table 2 shows monthly average SST for winter 2022–23, where we see each month was nearly 3°F or more above the 1991–2020 climatological average. February showed the largest deviation from the CRP, with an average SST anomaly of 4.11°F. Both December 2022 and February 2023 ranked as the warmest December and February on record, with January 2023 not far behind, ranking as the third warmest January over the 1982–2023 dataset.
Seasonal Trends and Anomalies in Context
The Gulf of Maine is an area of particular interest to the scientific community because of the remarkable rate of warming it has experienced over the past few decades coupled with its importance as a major driver for the regional economy.
When looking at average winter temperatures from the beginning of the satellite record in 1982 (Figure 2), there is a clear long-term increase, with SSTs warming at a rate of 0.81°F per decade. This rate of seasonal wintertime warming is ~4x the rate at which global ocean temperatures are warming (0.21°F per decade).

The unprecedented levels of warmth over the past decade or so are consistent with what researchers believe has been a distinct regime shift in the major influences on SSTs in the Gulf of Maine. The drivers of this (e.g., a potential weakening of the Atlantic Meridional Overturning Circulation, widening of the Gulf Stream, changes in characteristics of the Labrador Current) have been well-documented in the peer-reviewed literature, including through research by GMRI scientists.
How Does this Winter Compare?
Winter 2022–23 is the new warmest winter season observed in the Gulf of Maine during the 41 years we have satellite data to analyze. The top 5 warmest winter seasons have all occurred in the last decade, as illustrated in Figure 3.

Marine Heatwave Conditions
The most commonly used definition of a “marine heatwave” (MHW) is when daily average SSTs exceed the 90th percentile of a climatological (i.e., 30-year) average for at least 5 consecutive days. Gaps of two days or less in this threshold do not constitute a break in the MHW event.
Using this broadly accepted definition, the Gulf of Maine has experienced MHW conditions for 82% of the days this past winter (Figure 4). A 16-day period over the New Year’s transition (Dec 27th–January 11th) were the only dates where SST fell below the threshold of a MHW.

Presenting SST conditions in terms of anomalies (Figure 5) as opposed to absolute values (Figure 4) illustrates in greater detail the magnitude of MHW conditions throughout the winter. The most extreme daily SST anomalies occurred in December, with temperatures approaching 5°F above the climatological average.

Heatmap of Temperature Anomalies and Heatwave Events
Looking at the full record of daily SST anomalies in the Gulf of Maine (Figure 6), the distinct thermal regime shift beginning around 2010 is evident. Indeed, since 2012, the Gulf of Maine has experienced far more persistent MHW conditions (indicated by solid black lines) than at any other point in the satellite record.

While it is clear in Figure 6 that MHWs have become a more regular and intense occurrence in the past decade, some viewers may note that there are fewer MHWs marked in this figure than in our previous SST updates. This difference reflects the change in the CRP used in our SST analyses as described in the beginning of this update. Many of the time periods where SSTs had been above the 90th percentile for the 1982–2011 CRP are no longer above that 90th percentile threshold for the 1991-2020 CRP, since this more recent 30-year period has experienced warmer average conditions in the Gulf of Maine.
Spatial Distribution of Seasonal Anomalies
From a spatial perspective, the Gulf of Maine and (most) surrounding areas experienced above average SSTs during winter 2022–23, but the warmest patches were to the south and east of Georges Bank, mostly outside the domain analyzed in preceding sections (Figure 7). The highest seasonally averaged SST anomaly of any location in Figure 7 was 11.41°F—along the southern edge the figure—outside the area represented by the analysis shown in Figures 1 through 6 above.

Monthly Temperature Anomalies
Monthly average SST anomalies across the region of study are shown in Figure 8. The warmest anomalies were observed in December and February and were largely confined to areas just beyond the region of study (i.e, beyond the continental shelf where the Gulf Stream and Labrador Current have significantly more influence on oceanic conditions).

A Note on Data Sources:
NOAA_ERSST_V5 data provided by the NOAA/OAR/ESRL PSL, Boulder, Colorado, USA.
NOAA High Resolution SST data provided by the NOAA/OAR/ESRL PSL, Boulder, Colorado, USA.
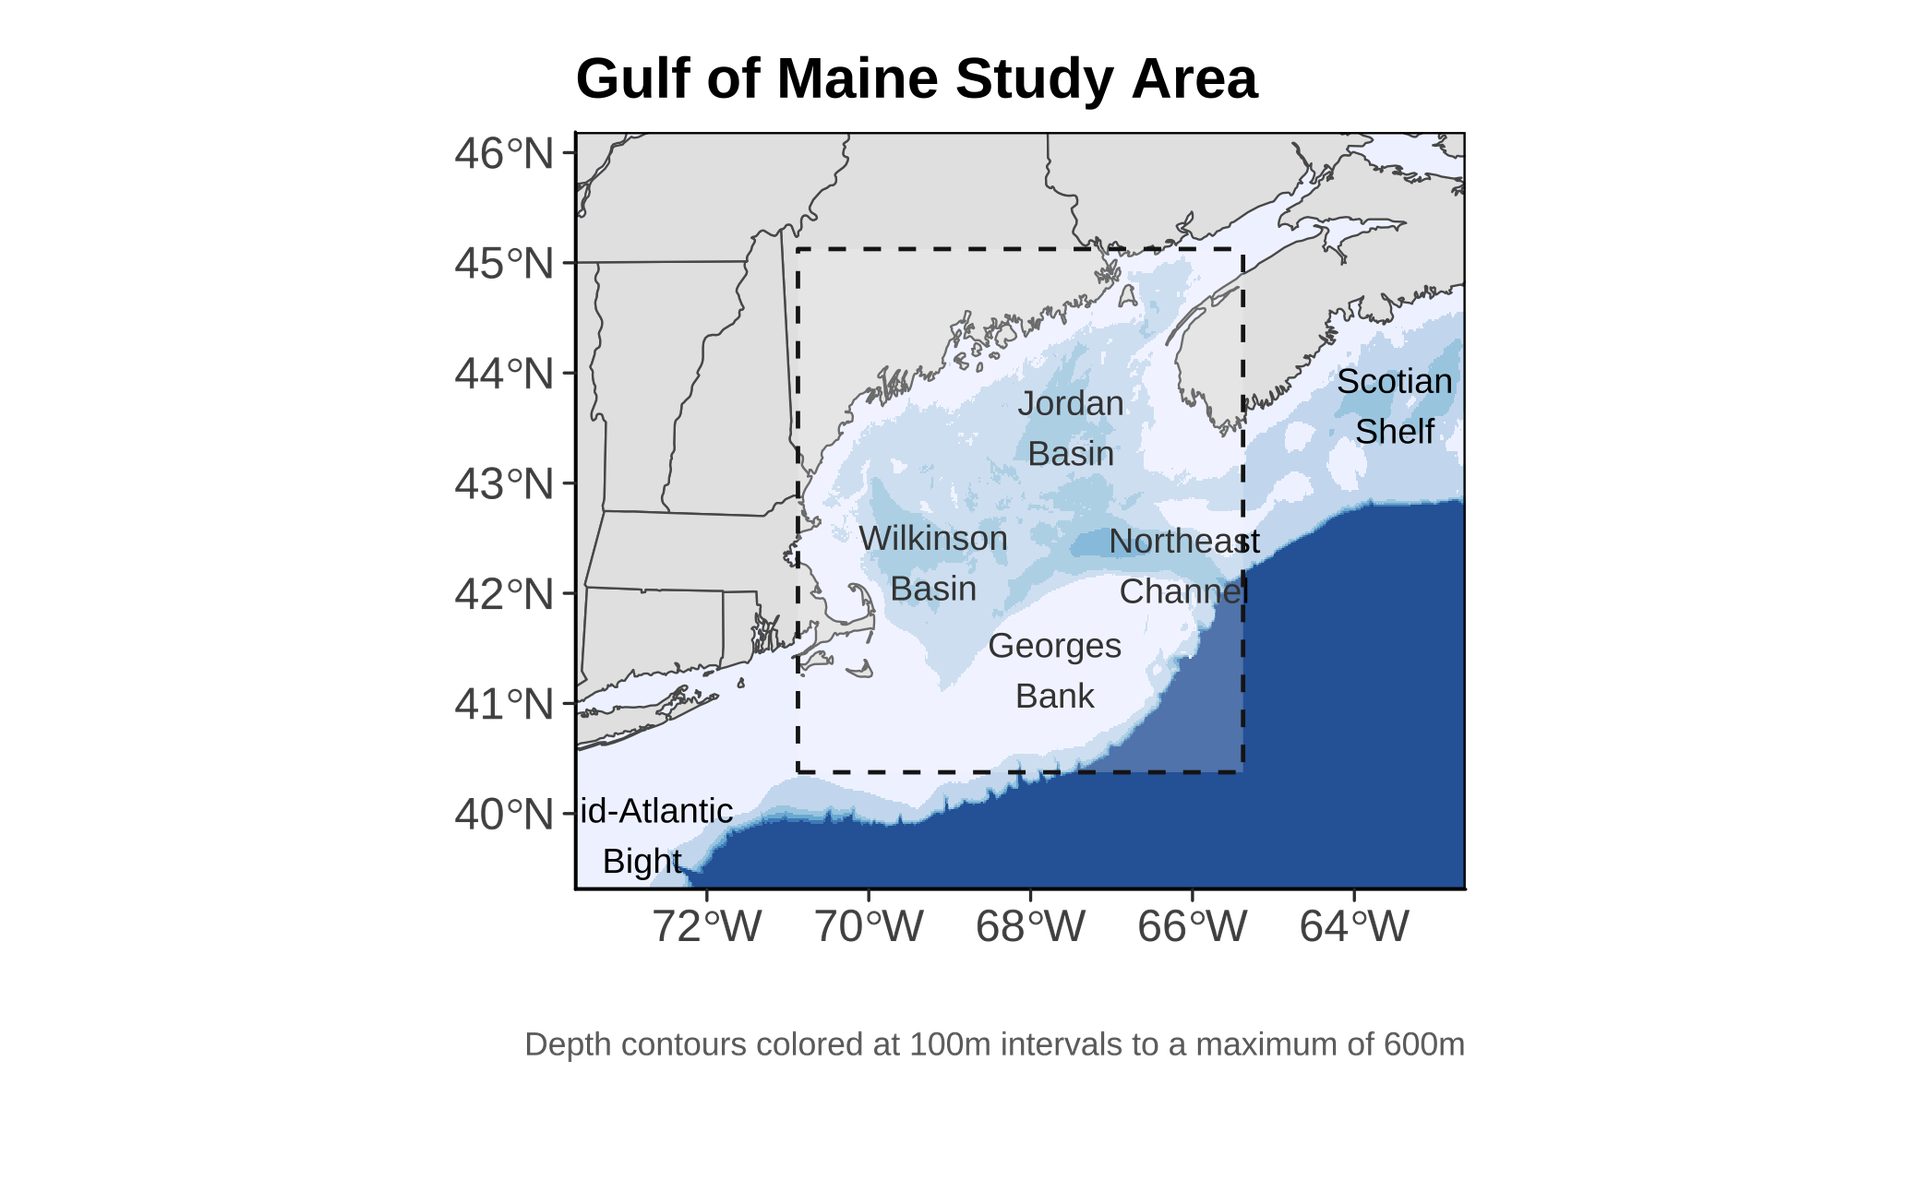
The Gulf of Maine Region
For analyses like these, it is important to be clear about the spatial extent that “defines” the Gulf of Maine (figure below), as different borders could produce different results. The spatial domain we use as the “Gulf of Maine” is displayed below. This area is consistent with previous reports and publications GMRI has produced.