2022 Gulf of Maine Warming Update: Second-Hottest Year on Record
Announcements | Feb 15, 2023
Over the past decade, scientists at the Gulf of Maine Research Institute have led a body of research that highlights the rapid pace of warming in the Gulf of Maine. To keep you informed, we share seasonal and annual updates about conditions in the Gulf of Maine.
Highlights from Another Remarkably Warm Year
With an annual average sea surface temperature (SST) of 53.66°F — more than 3.72°F above the long-term (1982 – 2011) average — the Gulf of Maine experienced its second-warmest year on record in 2022. This year fell short of the previous warmest year on record — 2021 — by 0.43°F, but was still record-breaking in a number of regards.
In nine of the twelve months this year, average monthly SST was within the top three warmest among all years on record.
The most extreme temperatures in 2022 occurred in November and December, each setting new records for highest monthly average SST in the Gulf of Maine.
The “coolest” monthly average temperature anomalies for 2022 occurred during July and September, but were still within the top ten for each of those months when compared to the full 40-year dataset (ranked 8th and 6th, respectively).
SSTs in 2022 were consistent with the long-term trend of increasingly warm conditions driven primarily by anthropogenic climate change.
Annual Sea Surface Temperature Trends
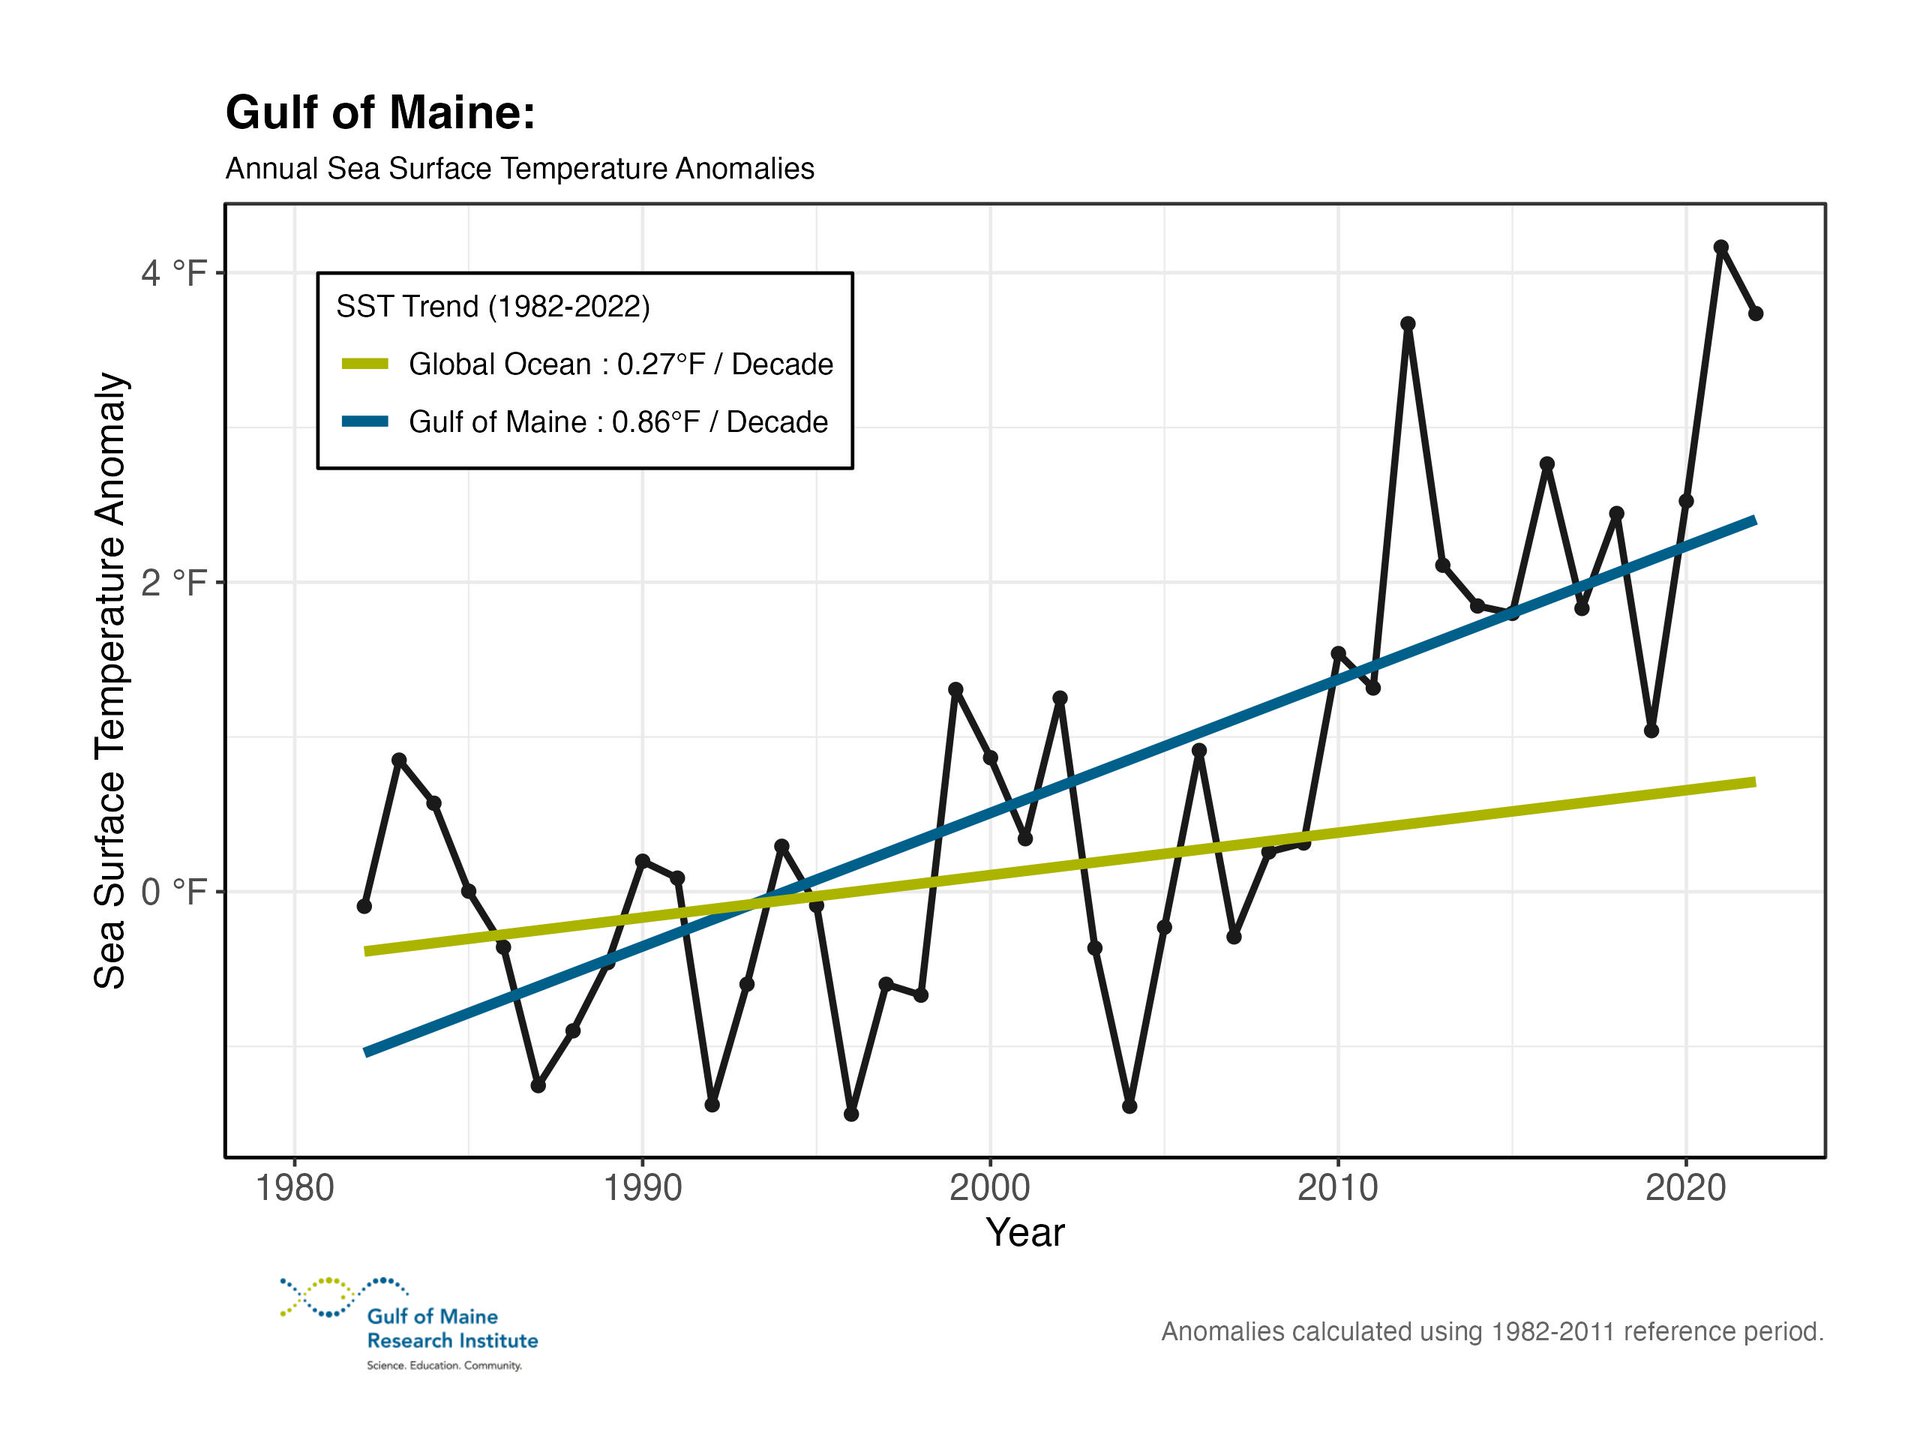
Since the early 1980s, the rate of warming in the Gulf of Maine (0.86°F per decade) has been more than triple that of the world’s oceans (0.27°F per decade; Figure 1). The precise causes of the pronounced jump in annual average SSTs in the region from 2009 to 2012 remains an area of active research, but the sustained warm conditions suggest a regime shift in the influence of major ocean currents (i.e., Gulf Stream vs Labrador Current) in the Gulf of Maine.
While a long-term increase in SSTs is expected as a result of human-caused climate change, we also expect each year to be influenced by large-scale patterns of natural variability, particularly on sub-global (i.e., regional) scales. SST conditions in the Gulf of Maine for 2022 retain the region’s distinction as being one of the fastest-warming ocean regions on the planet; with the 2022 data showing that the Gulf of Maine is warming faster than 97% of the world’s ocean surface.
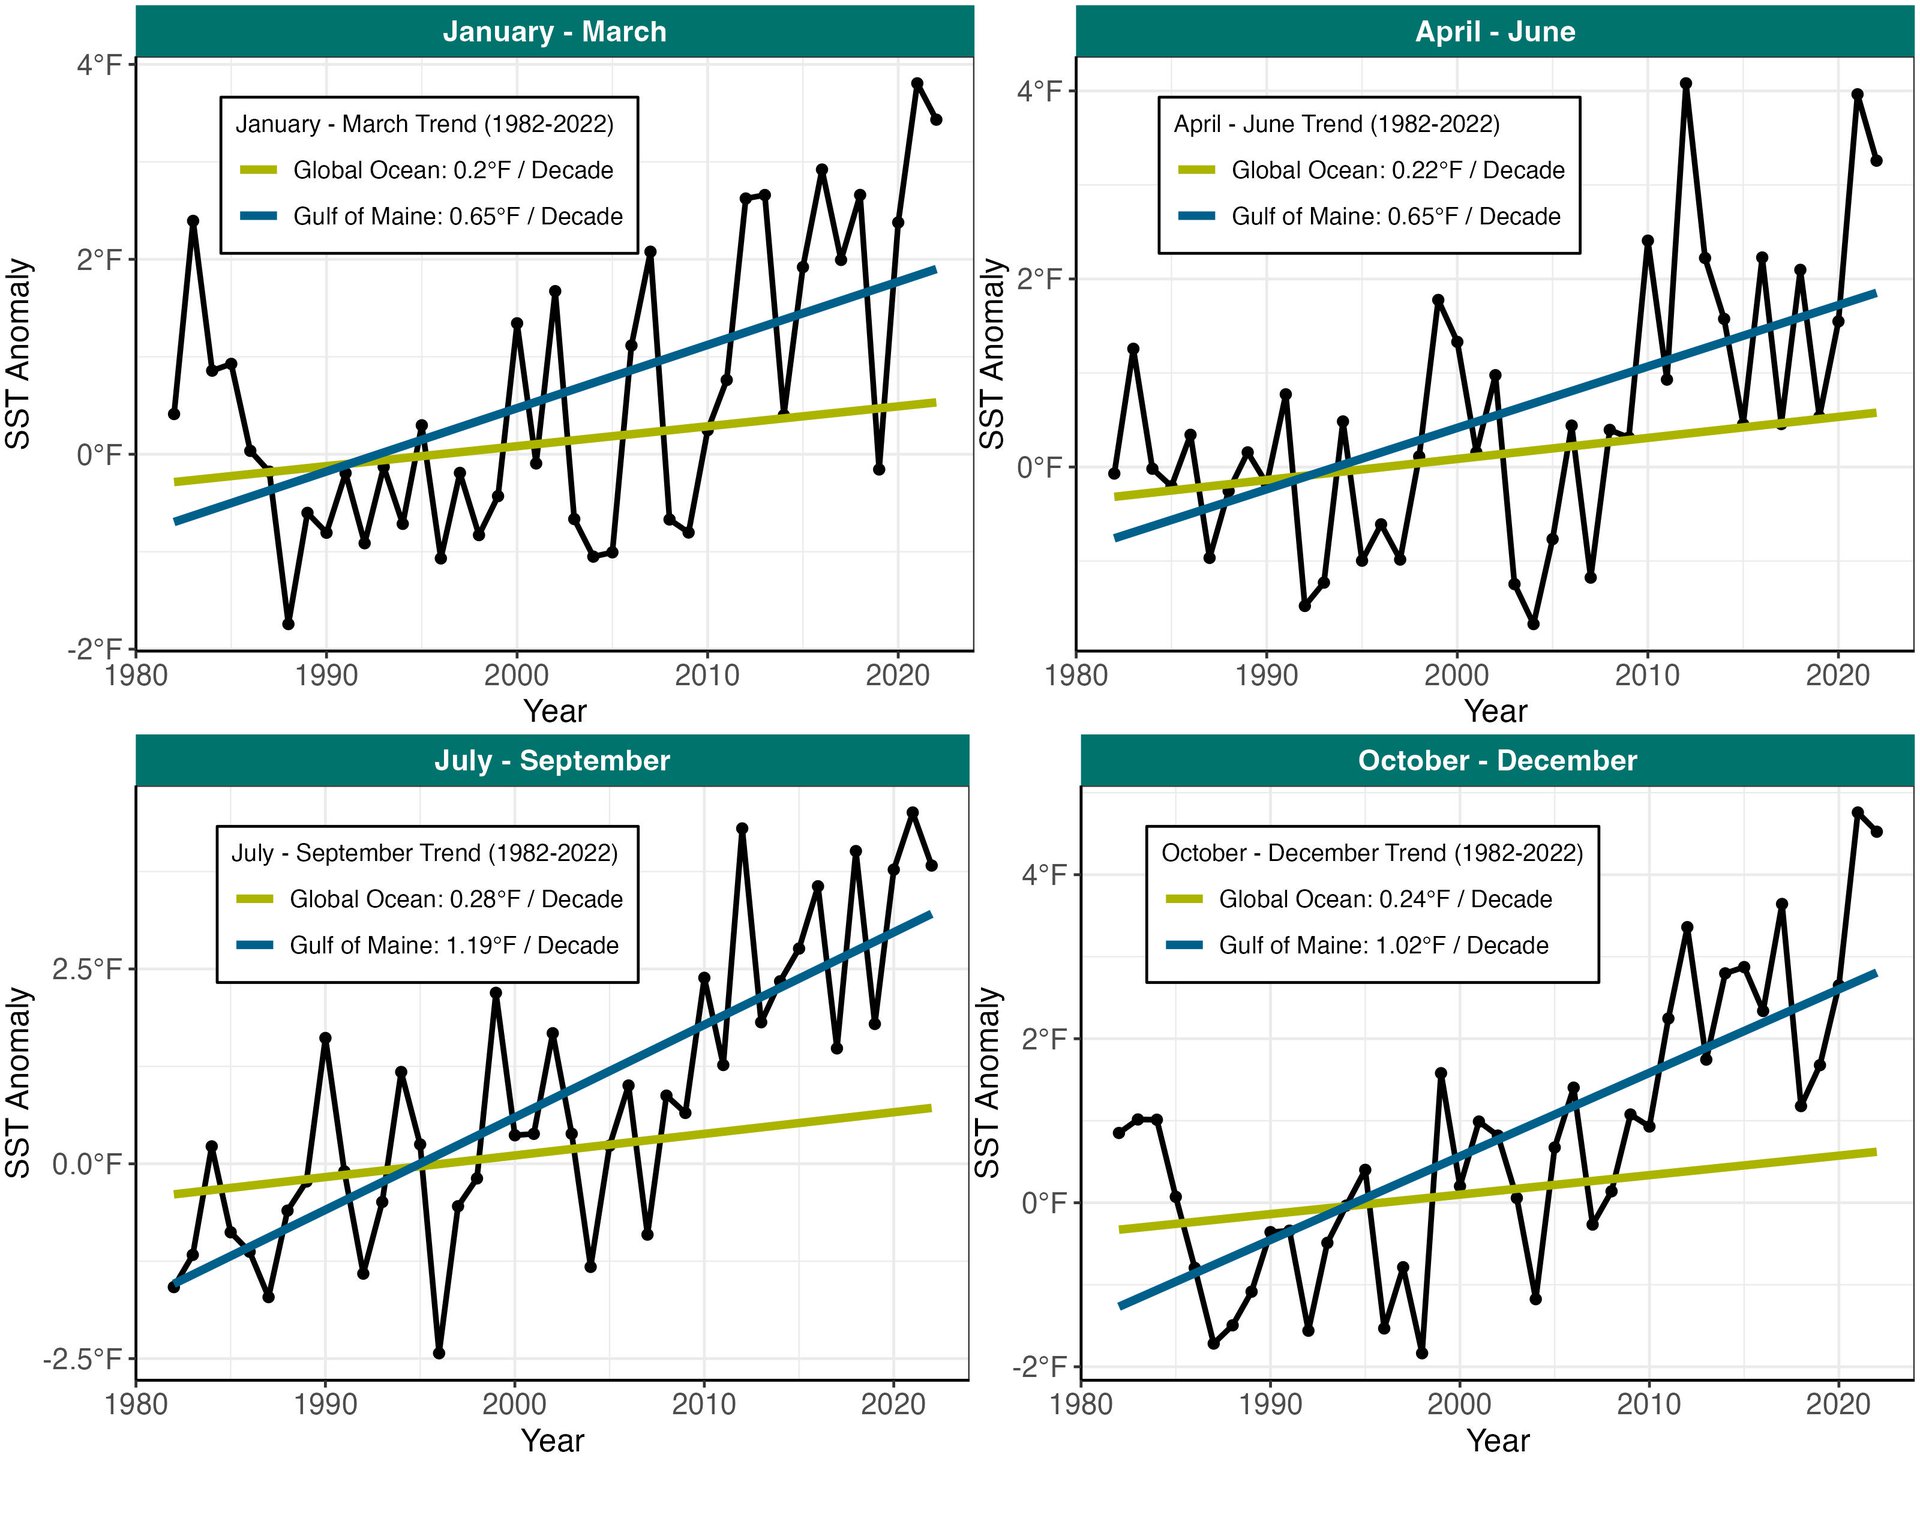
Zooming in to sub-annual timescales reveals some interesting patterns: the observed rate of warming in the Gulf of Maine varies throughout the year. Comparisons across the four quarters of the year (Figure 2) reveal that the Gulf of Maine is warming fastest during July-September (~4x the global ocean average) — almost twice the rate seen during January-June (~3x the global ocean average).
Spatial Variability in Sea Surface Temperatures
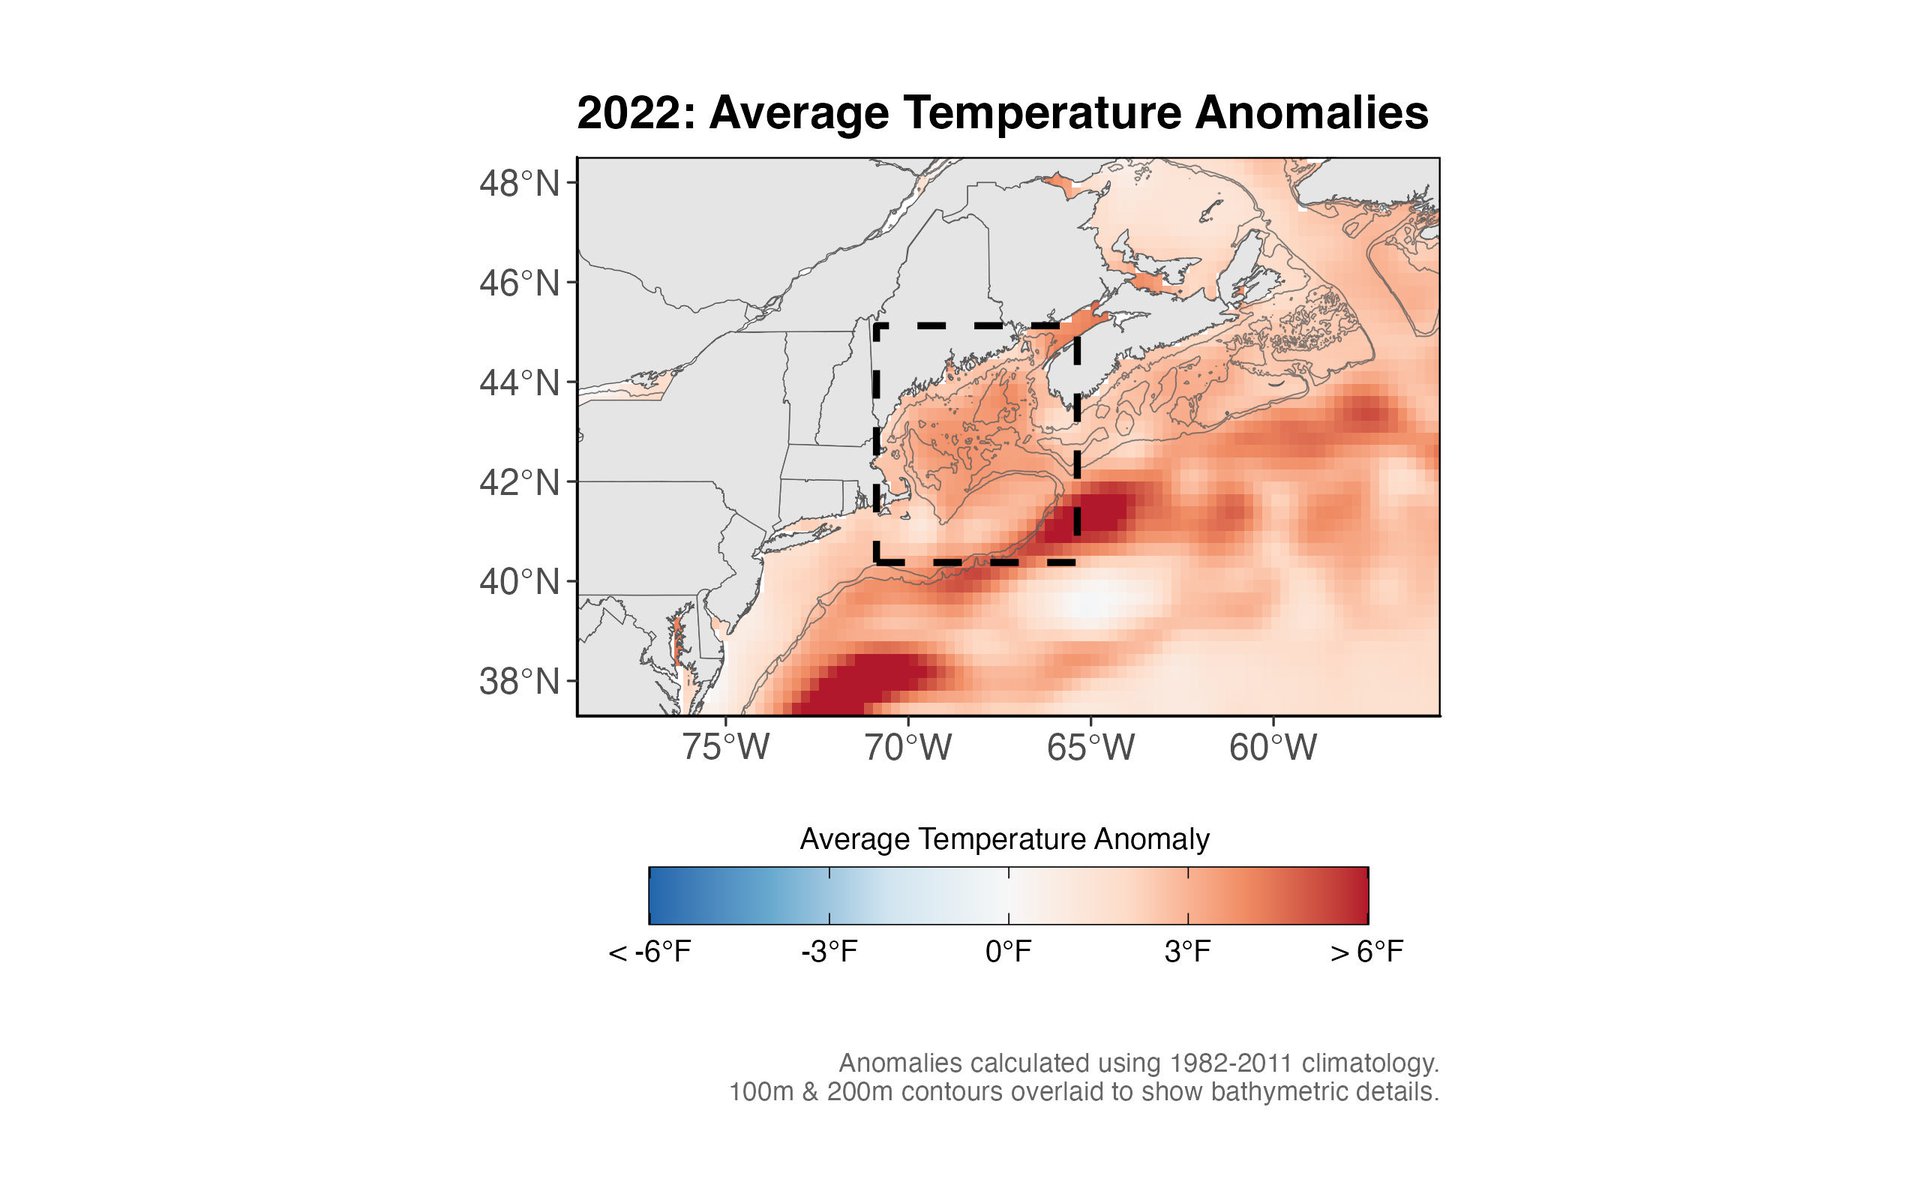
In addition to the sub-annual (or temporal) variation, there can also be significant spatial variability in annually-averaged SST patterns. The Gulf of Maine illustrated this fact, with the region southeast of Georges Bank exhibiting the highest annual average SST anomalies (Figure 3). This area is more susceptible than other areas in the region of study to large-scale variability in major oceanic currents, such as the relative influence of the Gulf Stream versus the Labrador Current.
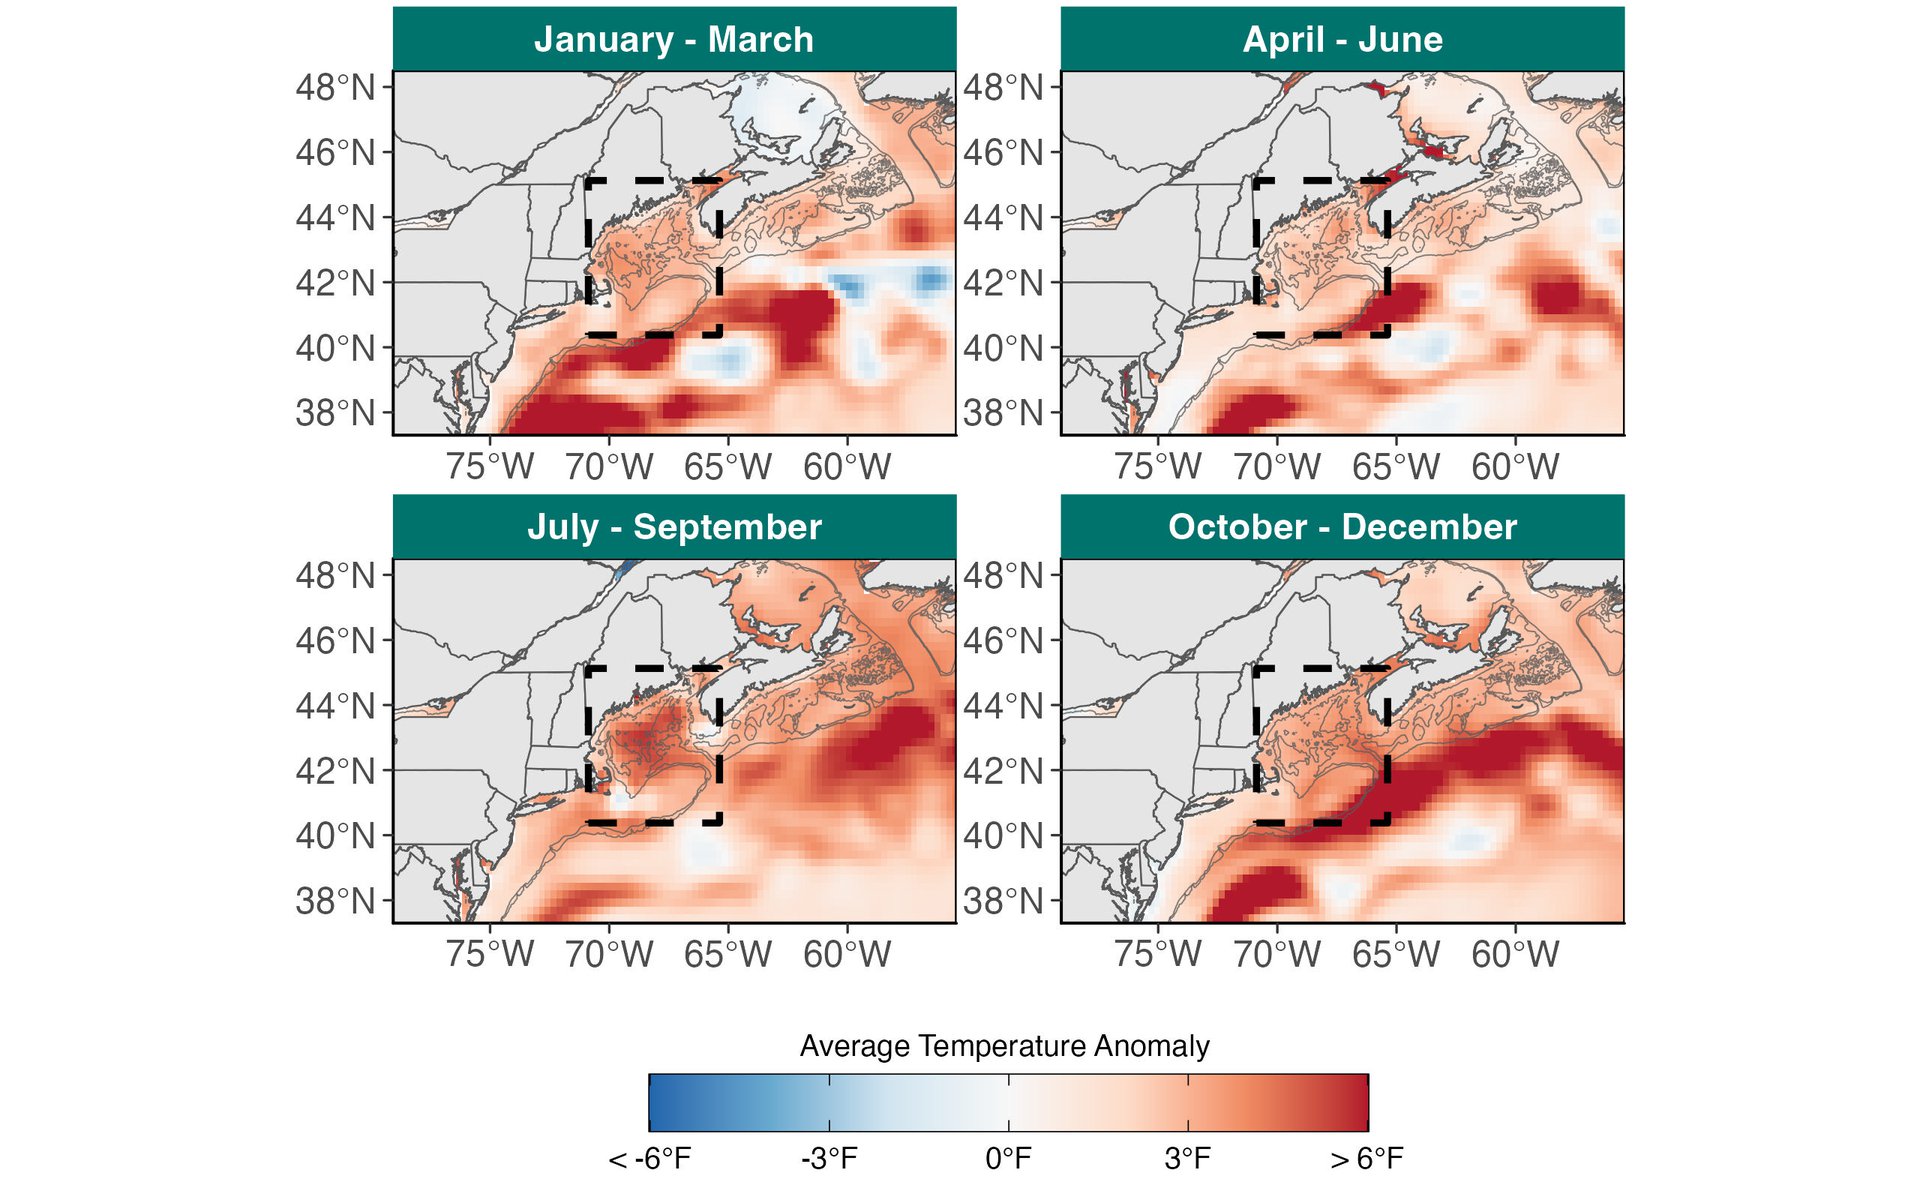
Looking at these spatial patterns across the annual quarters of 2022 (Figure 4) shows not only the large spatial variability in SST conditions, but also how that spatial variability can, itself, vary significantly over the course of the year. While the open ocean beyond Georges Bank exhibits significant spatial and temporal variability, Figure 4 also illustrates that the Gulf of Maine experiences more consistent SST conditions spatially and temporally (i.e., the entire region is anomalously warm throughout the year and the warmest areas tend to be those that are most heavily influenced by inflow from the Northeast Channel — the deep valley south of Nova Scotia and just off the northeast tip of Georges Bank).
Annual Average 2022 SST Compared to Historical Conditions
When we compare the annual average SST in the Gulf of Maine for 2022 (53.66°F) to other years, we can see it narrowly beat out 2012 as the second warmest year on record. When we look at the deviation from the long-term average SST (i.e., the annual SST anomaly), the last decade stands out for its exceptional warmth (Figure 5). 2022 extends a pattern that began in 2010 of sustained above-average temperatures. With the exception of 2019 (ranked 13th), every one of the last ten years remains in the top ten warmest years on record.
![Figure 5. A ranking of the top ten annual SST values [bars] and those years’ respective SST anomalies [x-axis].](https://d3esu6nj4wau0q.cloudfront.net/images/Annual_temp_ranks_plot.width-1920.png)
Comparison to Global Temperatures
It was not just the Gulf of Maine that experienced exceptional warmth in 2022, however. Globally, 2022 was the third warmest year for SSTs, and sixth warmest year for combined land and ocean temperatures. Figure 6 shows annual average SST anomalies all over the world in 2022. While much of the Southern Ocean and expanses of the southeastern Pacific were anomalously cool (a general feature of La Niña conditions), most of the world’s oceans experienced unusually warm temperatures in 2022. This is particularly true for northern midlatitudes, especially the northwestern Pacific (off Japan) and along the Eastern Seaboard of the United States — a region that includes the Gulf of Maine.

Daily Sea Surface Temperatures
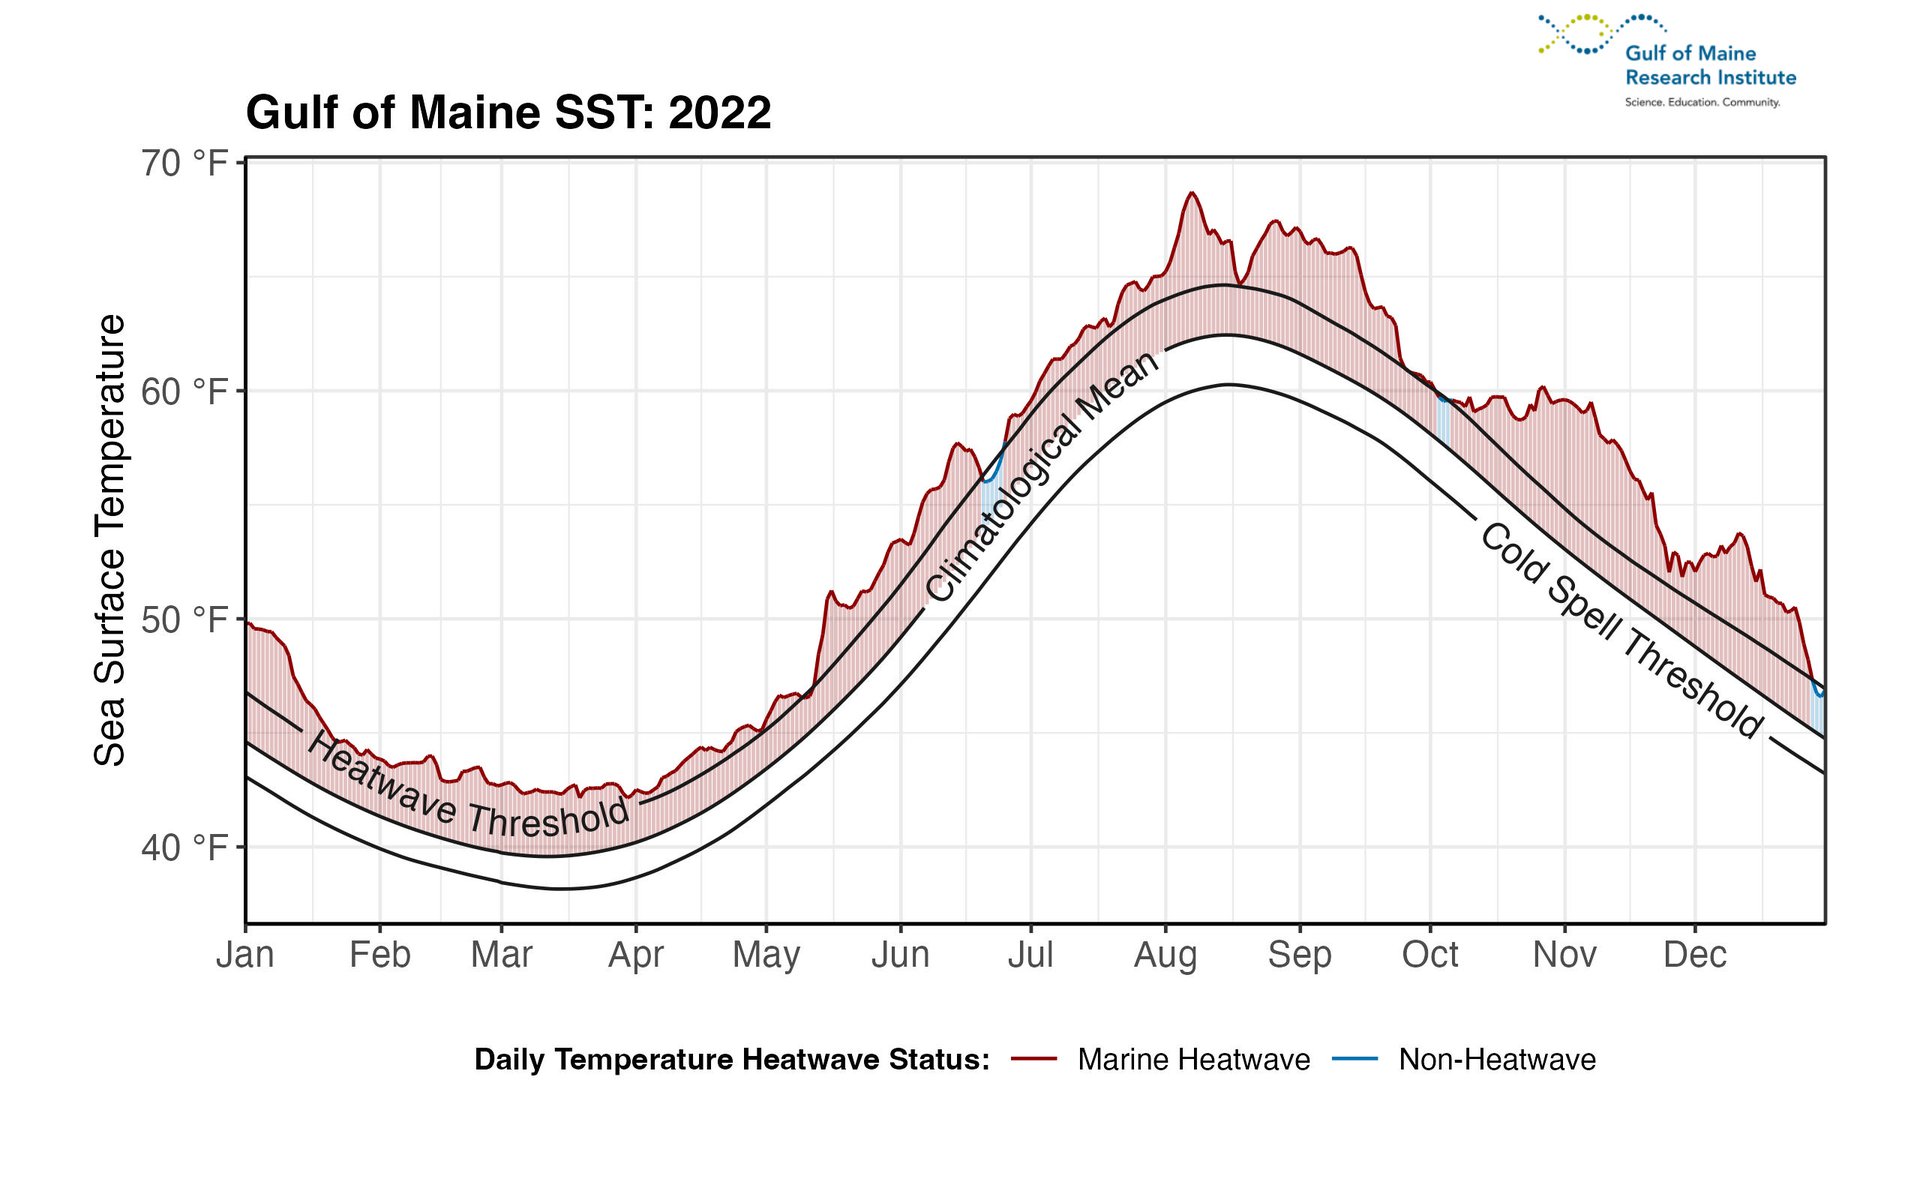
The annual cycle of SST in the Gulf of Maine exhibits a pattern common to regions in the Northern Hemisphere, with the lowest temperatures observed in March and the highest values observed in August (Figure 7). Daily SST anomalies in 2022 never fell below +1.59 °F compared to the long-term (1982 – 2011) average and reached as high as +7.36 °F above the long-term average. The largest temperature anomalies were observed during November, which also turned out to be the warmest November on record (as highlighted in our Fall 2022 update). Figure 7 also illustrates that, in 2022, 353 days experienced SST anomalies that exceeded the threshold for being considered marine heatwaves, or MHW (more on MHWs below, including Figure 9).
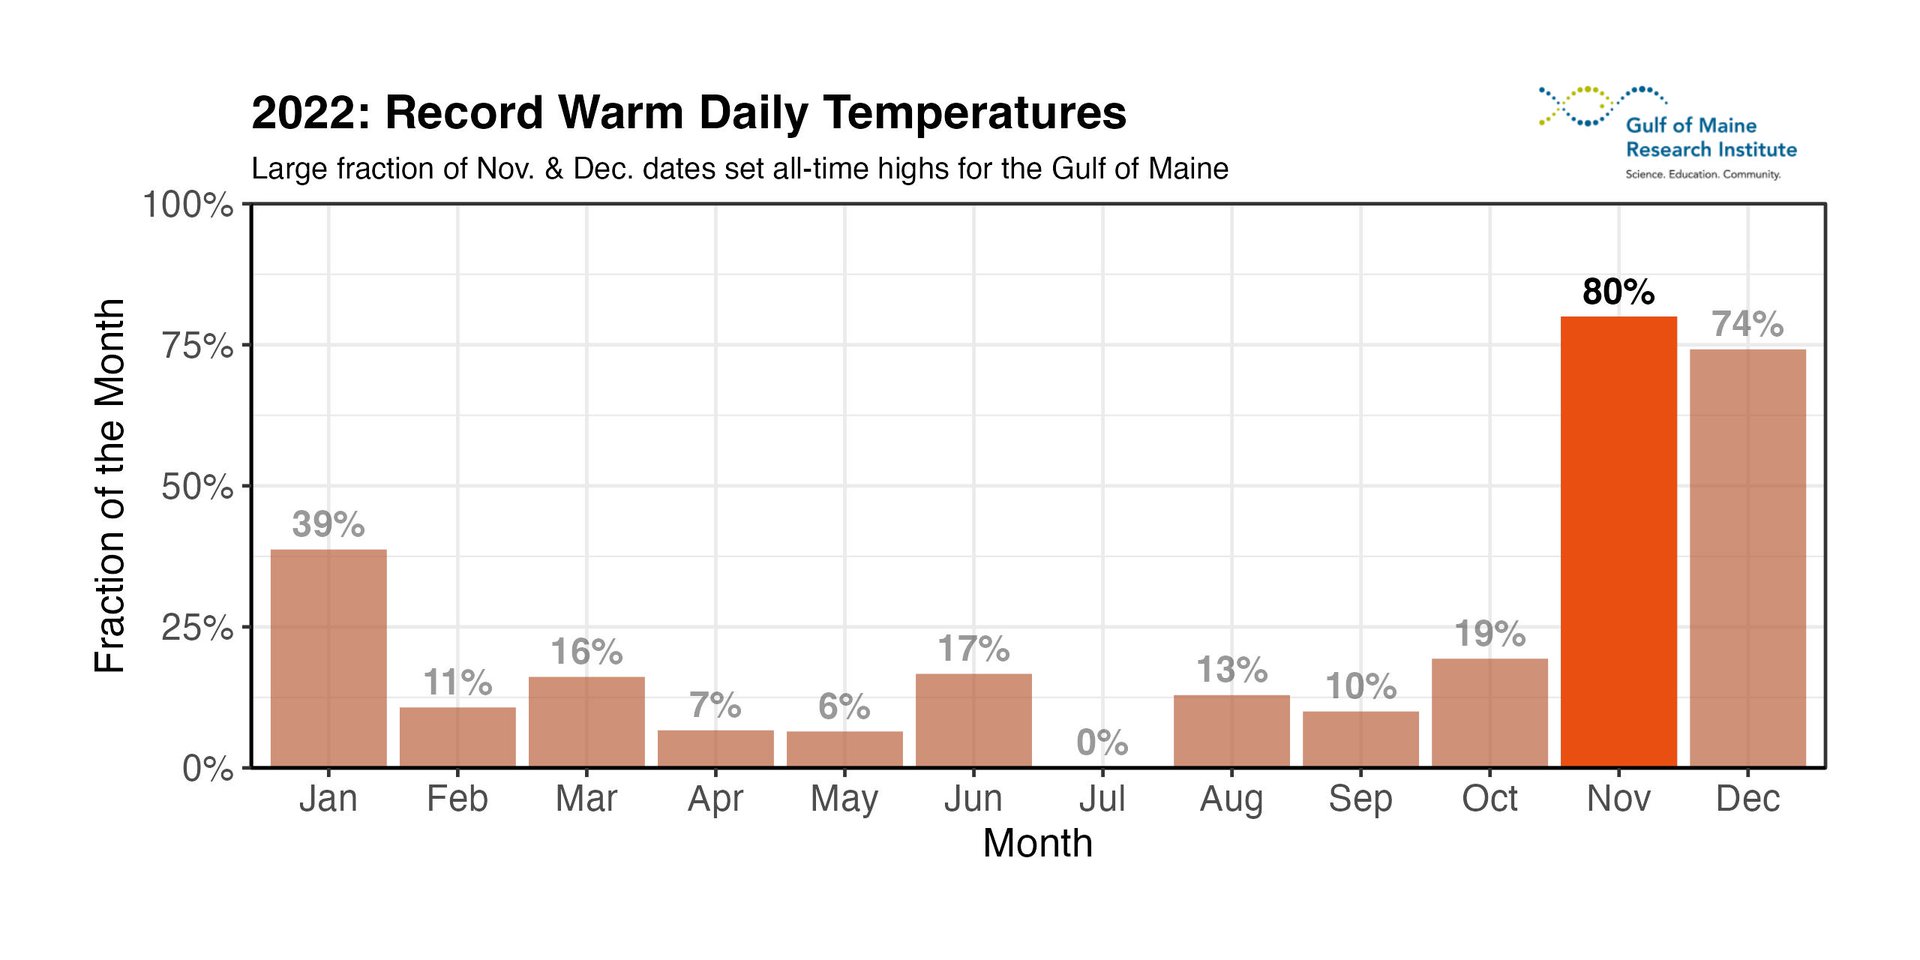
Daily SST values in 2022 were some of the highest ever recorded in the Gulf of Maine. Record daily high SSTs were set for more than half of all days in November and December, with new records set in all months but July (Figure 8). The most daily records in a single month occurred in November, which experienced record high SSTs for 24 of the month’s 30 days. In total, record high daily temperatures were reached on 169 days during 2022 — stated another way: nearly 46% of the year experienced record high SSTs.
More Persistent, Intense Heatwaves in Recent Years
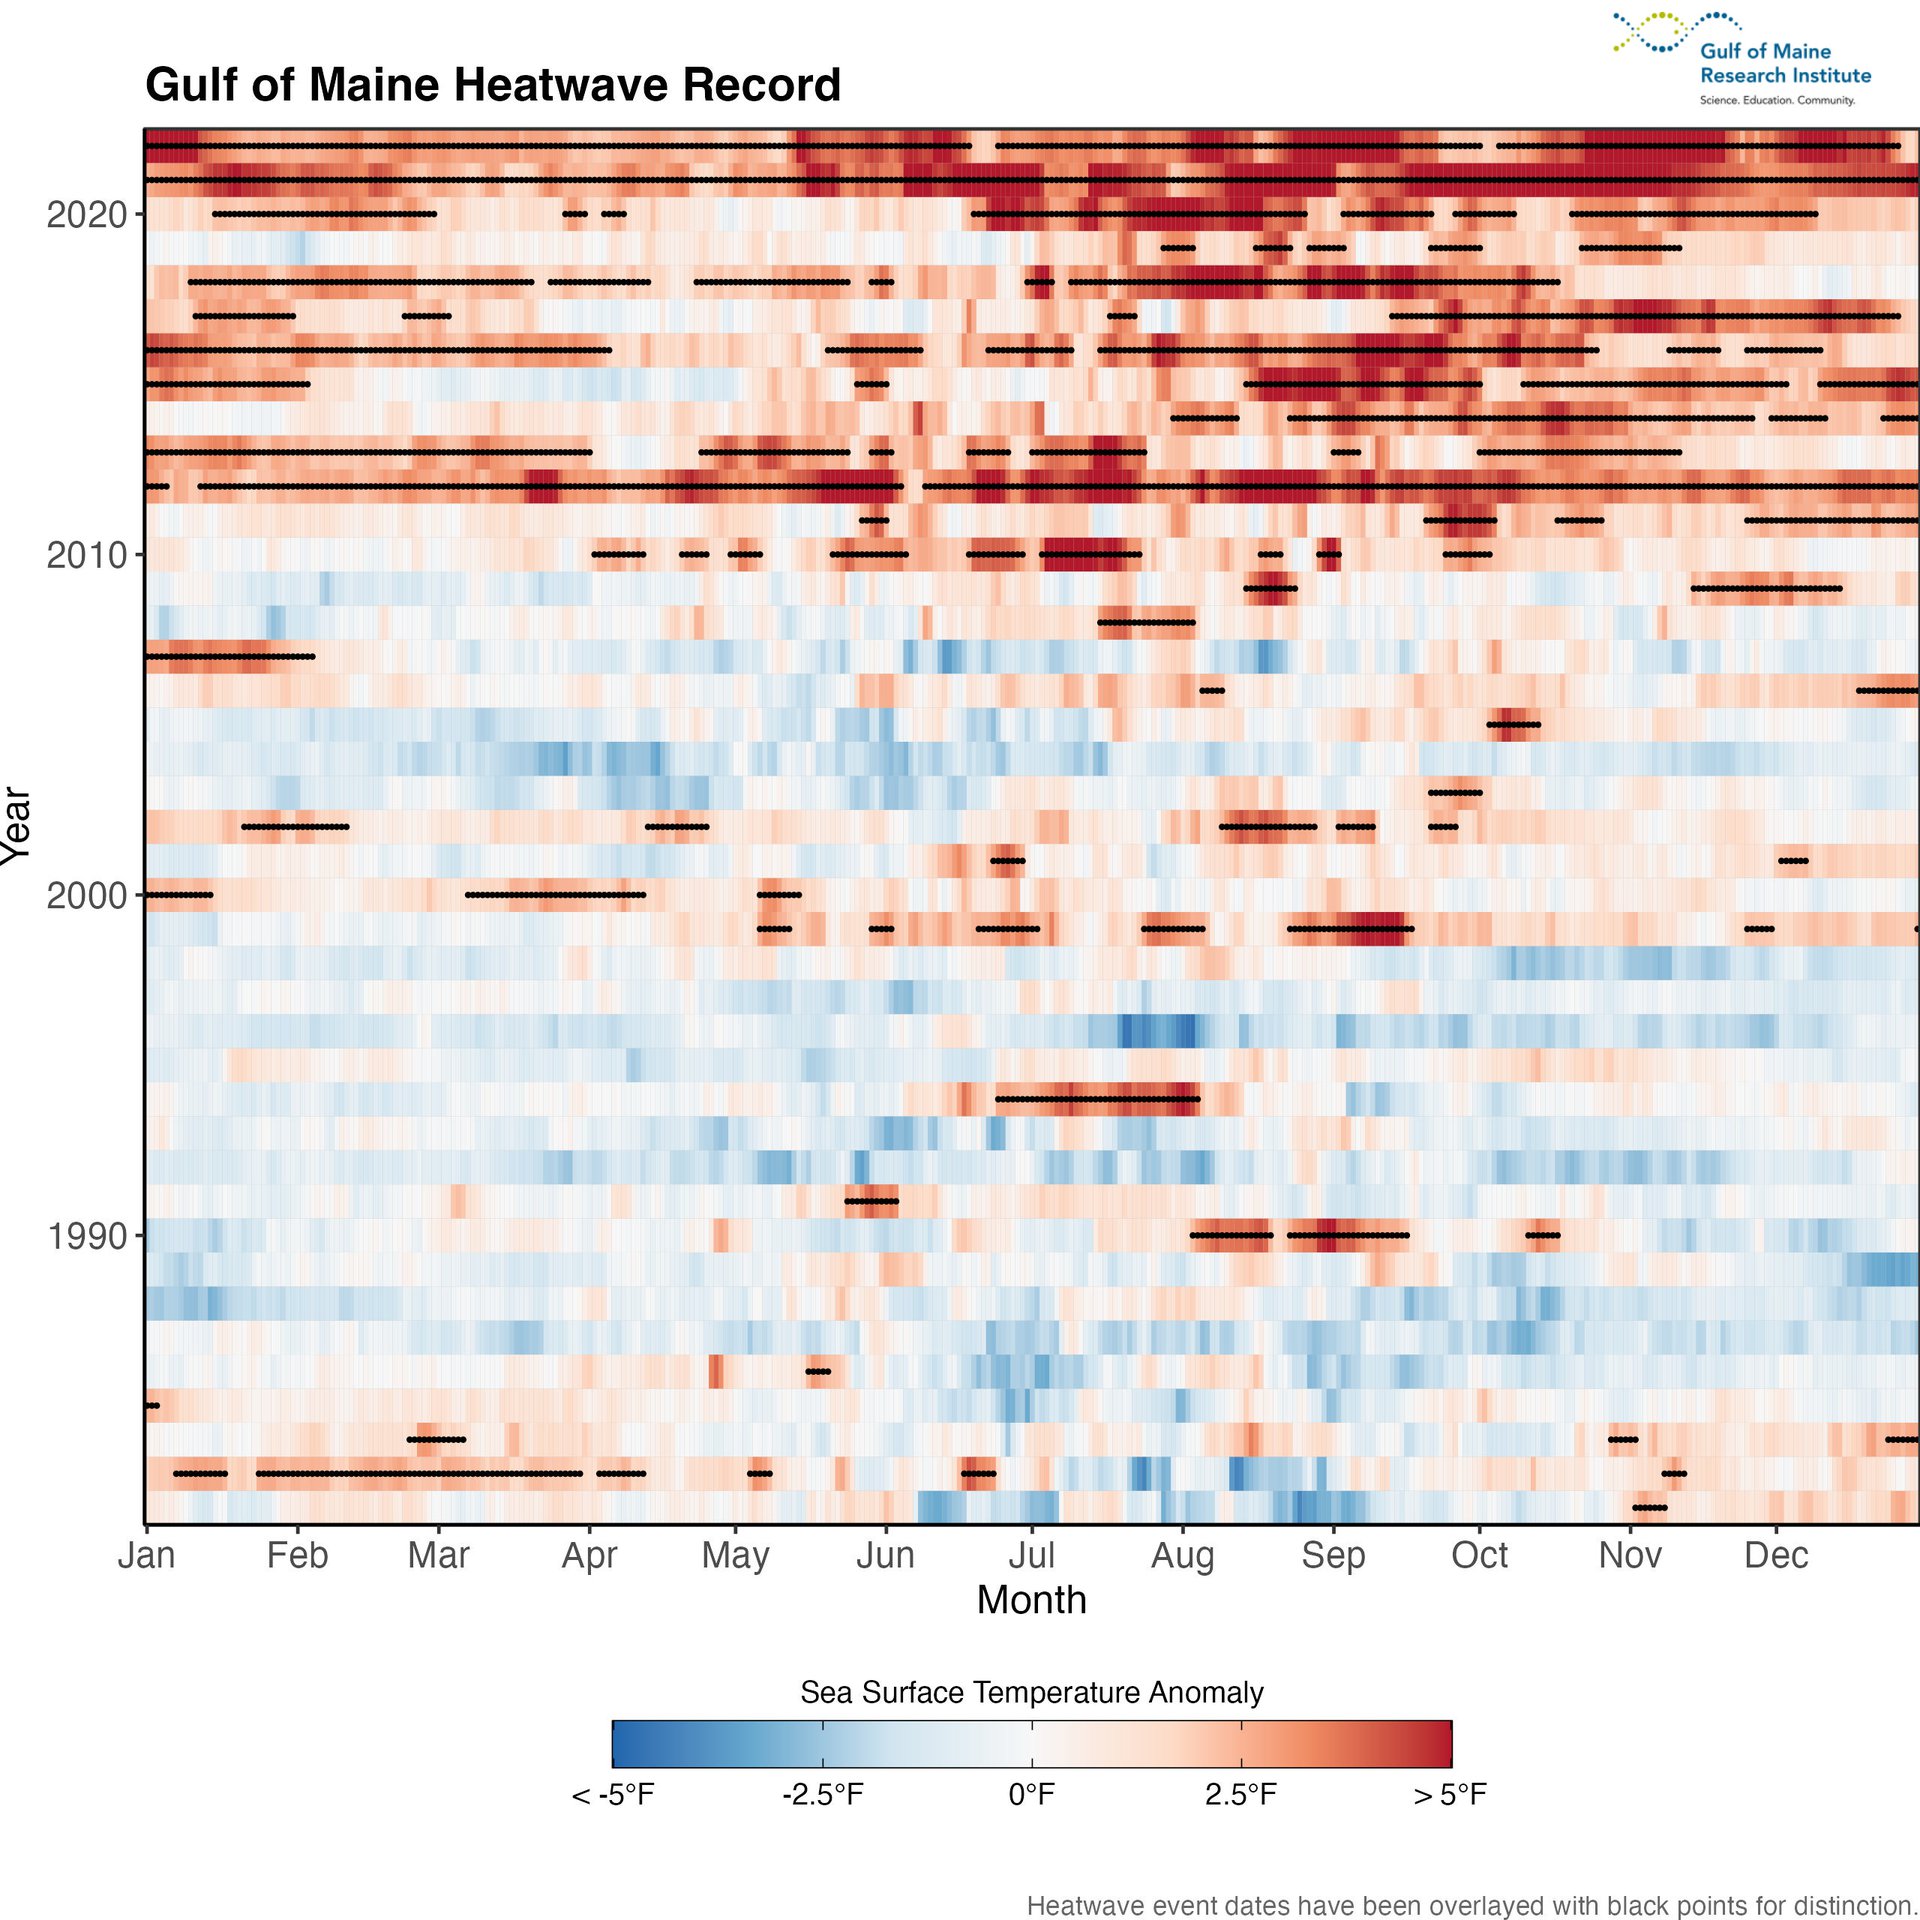
A marine heatwave (MHW) is defined as a period when the daily average SST is greater than the 90th percentile of the long-term (1982 – 2011) average for five or more consecutive days. Gaps of two days or less in this threshold do not constitute a break in the MHW event. Figure 9 illustrates that the Gulf of Maine met the criteria for experiencing a MHW for 353 days in 2022 (or 97% of the year). Superimposing MHW status (black line) over the full timeseries of daily SST anomalies (blue/white/red shading) (Figure 9) reveals that the frequency, duration, and intensity of MHWs has increased in the past decade.
In a world without human-caused climate change, we would expect, positive (warm) and negative (cool) SST anomalies to more or less balance out over the span of several years, as various patterns of natural climate variability alternate having a dominant influence on Earth’s climate (e.g., La Niña vs El Niño). What is being observed in the Gulf of Maine (and elsewhere around the world), however, is a loss of that balance: larger fractions of recent years are experiencing above average temperatures and cold spells are becoming vanishingly rare.
Forthcoming Methodological Changes to GMRI SST Updates
These seasonal and annual temperature updates rely on a climatological reference period — referred to as a “normal” in the climate science community — against which we calculate anomalies. Starting with our next update, we will be adjusting this “normal” period in our calculations. To date, we have used 1982 – 2011 as the 30-year climatological reference period, and going forward, we will be using 1991 – 2020 as our climatological reference period.
This update is standard practice: as time progresses, more data are collected, and new 30-year “normals” can be calculated every decade. However, since the period of 1991 – 2020 was warmer than 1982 – 2011, we can expect warm anomalies to be lower than those we report in this and prior updates. To be clear, this result will be merely an artifact of the shifting reference period, not an indication that warming in the Gulf of Maine has decreased.
In addition, we will be modifying how we characterize and communicate about marine heatwaves. The concept of a marine heatwave emerged as a way to communicate a rare phenomenon where temperatures were much higher than historical conditions for a defined duration of time. As temperatures increase globally, SST observations that were once rare have become more common. Understanding this pattern, scientists now are considering new ways to define and communicate about marine heatwaves.
GMRI scientists are part of this evolving discussion in the international scientific community, and we will incorporate alternative approaches for characterizing marine heatwaves in future updates.
A Note on Data Sources
The figures in this report are created using remotely-sensed satellite data as part of publicly funded research efforts. Satellite SST data was obtained from NOAA’s National Center for Environmental Information (NCEI), with all maps and figures displaying NOAA’s Optimum Interpolation Sea Surface Temperature Data.
Recommended Citation
Gulf of Maine Research Institute, 2023. 2022 Gulf of Maine Warming Update: Second-Hottest Year on Record. https://gmri.org/stories/warming-22
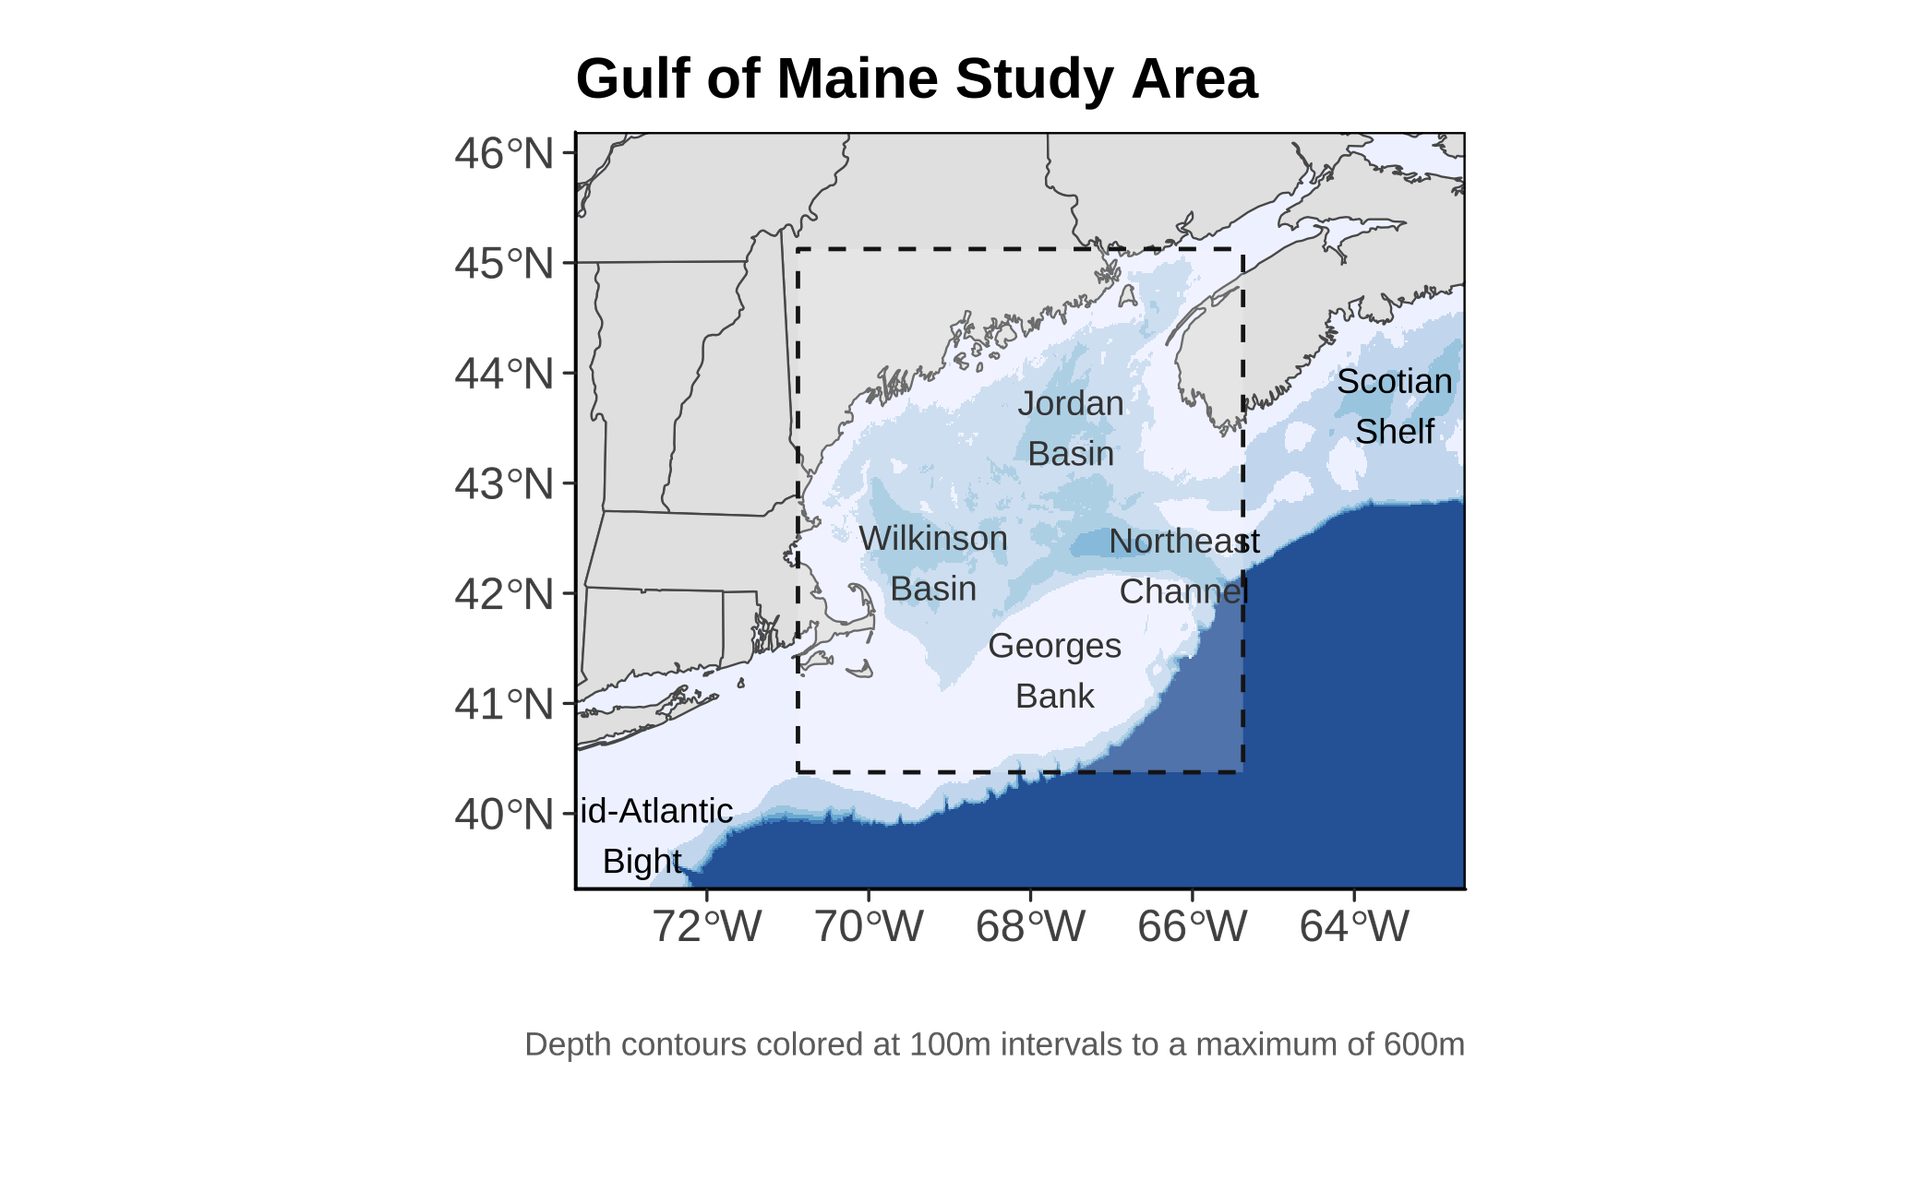
The Gulf of Maine Region
For analyses like these, it is important to be clear about the spatial extent that “defines” the Gulf of Maine (figure below), as different borders could produce different results. The spatial domain we use as the “Gulf of Maine” is displayed below. This area is consistent with previous reports and publications GMRI has produced.
Contributing Scientists
-
![the staff photo for Kathy Mills]()
-
![This is the staff photo for david reidmiller]()
-
![Adam Kemberling]()
Adam Kemberling
Former Quantitative Research Associate